关键词 > Python代写
INTRODUCTION TO DATA SCIENCE AND SYSTEMS (M)
发布时间:2021-04-13
Thursday 19 December 2019
1.00 pm – 2.30 pm
(1 hour 30 minutes)
DEGREE of MSc
INTRODUCTION TO DATA SCIENCE AND
SYSTEMS (M)
Answer all 3 questions
This examination paper is worth a total of 60 marks.
The use of calculators is not permitted in this examination.
INSTRUCTIONS TO INVIGILATORS: Please collect all exam
question papers and exam answer scripts and retain for school
to collect. Candidates must not remove exam question papers.
1. Linear algebra, probability, visualisation and optimisation
Your data science team has been asked to analyse a subsystem for a car manufacturer. After some experimentation it is clear that the system you are considering can be described by the following set of coupled equations:
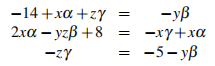
where x = 1, y = 2,z = 3 are scalar inputs to the system and the output of the system is de-noted by c = f ([x, y,z]T ,[α,β, γ]T) = [14,−8,−5]>. b = [α,β, γ]> is a vector containing the parameters of the system.
(a) Convert the set of coupled equations in Eq. (1) into the matrix form Ab = c. [3]
(b) You are now asked to find the parameters, b, of the system using a numerical optimization method without the availability of standard solvers and matrix inversion.
(i) Define an optimization problem that would allow you to solve a problem of the type Ab = c with respect to b with the constraint that you cannot use matrix inversion but have access to partial derivatives of A, b and c with respect to b. [2]
(ii) State a form of the update equations for standard gradient descent which will allow you to solve the optimization problem outlined in the previous question and explain under which conditions your gradient descent optimization algorithm is guaranteed to converge. [4]
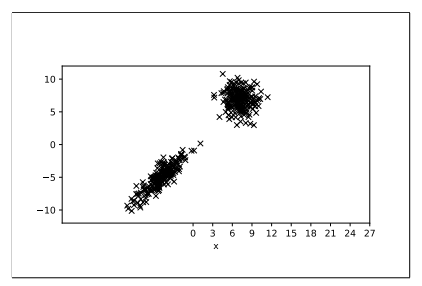
Figure 1: A scatter plot illustrating two datasets. The two different datasets can clearly be identified as two distinct clusters (as validated by the manager)
(c) Your manager has provided you with two datasets obtained on two different days each containing several observation of x and y.
(i) Your manager has illustrated the observations in Figure 1. Criticise this graph, and redraw a sketch that corrects the issues you have identified. [3]
(ii) Your manager asks you to summarise each of the datasets using a separate Normal distribution for each dataset. Explain how you would parameterise the Normal distribu-tions needed to model the (x,y) values from the two individual datasets, including a description of the array shape of any parameters that the distribution would have. [3]
(iii) Explain how eigendecomposition could be used on the parameters estimated in the previous question to identify the major axis of variation. Draw a simple sketch to show: the data points; the estimated normal distributions; the relevant eigenvectors (for each dataset separately). [5]
2. Text processing in data science
(a)
(i) Consider two documents with term frequency vectors as follows: D1 = [4, 2, 0] and D2 = [2, 0, 4]. Calculate the cosine similarity between these two documents. Give the formula for cosine similarity and show your workings. Note: the final result may be in the form of a formula. [3]
(ii) Name and describe an application where cosine could be used. Justify why cosine should be used for this application, explain the key geometric properties of cosine similarity and why it is important for the application. [2]
(iii) Your are given the following list of documents in python: docs = (‘The sky is green’, ‘The sun is yellow’, ‘We can see the shining sun, the bright sun in the sky’). Write python code to compute the TF-IDF cosine similarity matrix of the docs list using the appropriate Sci-Kit Learn libraries. [3]
(iv) Define the concept of lemmatization. Compare and contrast it with stemming. [2]
(b)
(i) Explain the k-means clustering algorithm using pseudo-code or precise word descrip-tions. Name and describe three key clustering properties of k-means. [3]
(ii) You work at a large social media company with an advertising network. Describe a task where k-means could be applied and describe how it would be implemented. Provide details including specifying appropriate textual features and their representation, the similarity function, and how to address issues of scale on large datasets. [3]
(iii) The default k-means algorithm runs on the task from part 2.b.(ii) for a very large data collection. The clustering is too slow and takes too long to complete. The product requirements dictate that the number of clusters and features are fixed. Discuss why it is slow and suggest a modification to the k-means algorithm that will speed it up. [2]
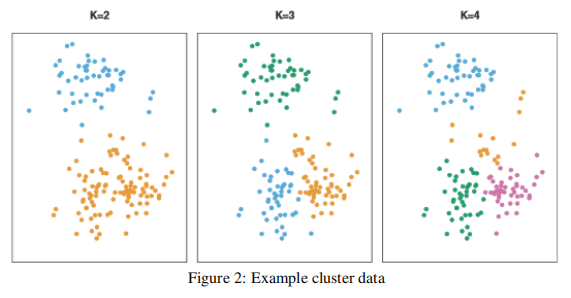
(iv) How many clusters would you guess the data illustrated in Figure 2 has? Describe the method you would use to determine a correct value of k. Does it matter if the value is determined over a single run vs many runs of the algorithm? Explain why or why not. [2]
3. Database systems
(a) Consider a relation Employee(ID, Name, Age) where the primary key (ID) is a 64-bit integer, Age is an 8-bit integer, and that we need 51 bytes for the Name attribute. Assume that the relation has 1000 tuples, stored in a file on disk organised in 512-byte blocks each having a 24-byte header. Note that the database system adopts fixed-length records – i.e., each file record corresponds to one tuple of the relation and vice versa.
(i) Compute the blocking factor and the number of blocks required to store this relation? [2]
(ii) Consider the following SQL query:
SELECT Name FROM Employee WHERE ID >= 101 AND ID <= 115
Estimate the expected query processing cost in terms of number of block accesses, when the relation file is organised as (a) a heap file, (b) a sequential file, ordered by primary key, and (c) a hash file using external hashing with the primary key as the hash key field, 256 buckets each containing one block, and no overflow buckets. [5]
(b) Consider two relations Employee E and Department D such that:
• Relation E has nE = 100 blocks and rE = 1000 records
• Relation D has nD = 50 blocks and rD = 10 records.
Assume that relation Employee (E) has an attribute SSN (Social Security Number) as its primary key, and that relation Department (D) has a unique attribute Mgr SSN (Manager’s SSN) being a foreign key referencing relation E’s SSN attribute. Note: Mgr SSN is unique and hence there is a single manager per department. Further assume that the memory of the database system can accommodate nB = 12 blocks for processing and the blocking factor for the join-results block is b f rRS = 10 records per block. Last, assume we execute the following equi-join query:
SELECT * FROM E, D WHERE D.Mgr SSN = E.SSN
(i) Assume that the query is processed using the nested-loop join algorithm. Estimate the total expected cost (in number of block accesses) for the various strategies and conclude which strategy is the most efficient. Show your work. [6]
(ii) Assume that there is a Level 2 Secondary Index over the Department relation for the unique attribute Mgr SSN, i.e., level xD = 2, and a Level 2 Primary Index over the Employee relation for the primary key SSN, i.e., level xE = 2. Propose two index-based nested-loop join strategies and explain which one is the best using these indexes. [7]
