关键词 > AMA1501/AMA1502
AMA1501 Introduction to Statistics for Business/AMA1502 Introduction to Statistics
发布时间:2021-03-30
The Hong Kong Polytechnic University
Department of Applied Mathematics
AMA1501 Introduction to Statistics for Business/
AMA1502 Introduction to Statistics
2020/21 Semester One
Assignment
This assignment has FOUR questions.
Attempt ALL questions.
DUE DATE: Please upload answers by Due Date: Friday, March 26, 2021 by 17:00
(in Week 9)
• Hand write solutions showing all proper steps on A4 paper using black or blue pen. Start each question on a new page and write your name and student number for each question. It is fine if the solution of one question contains more than one page.
• For full credits, you should have each of the following elements in your solution: (i) technical terms and variables in problem are well defined; (ii) important steps in the solution are clearly shown and justified; (iii) there is an obvious conclusion summarizing each questions answer.
• You may assume 4 digits after the decimal in all your final numerical answers.
• Scan or take photo of your solutions page by page, make sure that the solutions are legible. Rotate the page if the picture is not in the right direction. No marks will be given if the marker can not read your handwriting. Please use CamScanner app to turn your picture or scan into a pdf file (please see ”Assignment” instructions on how to use CamScanner).
• Each solution to ONE question must be contained in only ONE pdf file, i.e., please combine the pictures of your solution to each question (in the correct order) into ONE pdf file. Therefore, for the assignment, you should upload 4 different pdf files for each of the 4 questions of the assignment.
• Name the files as GroupNo-StudentID-Q1 (2, 3, 4, or 5), e.g. Group201- 19123456D-Q1. Upload the pdf files to ”Upload Assignment Question 1, (2, 3, 4) Answer Here” on your AMA 1501 Blackboard website, respectively - under the ”Assignment” link/folder.
• Reserve enough time to prepare and upload your solutions. Make sure that you finish up-loading the files before Friday, March 26, 2021 by 17:00. Late Assignments wii not be accepted!!!
• Formula Sheets, Standardised Normal Distribution table and Student’s t-distribution table are attached.
1. The following data represent the difference in scores between the winning and losing teams in a sample of 30 college football bowl games from 2018-2019.
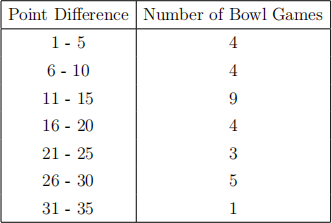
(a) Find the mean, median, mode and standard deviation. [9 marks]
(b) Calculate the Coefficient of Variation and Pearson’s 1st and 2nd Coefficient of Skewness. [4 marks]
(c) Describe the shape of the above data with explanation. [3 marks]
(d) From a random sample of 100 college football bowls games picked in 2018-2019, estimate the number of college football games that have point difference between 8 and 17 using the frequency distribution table provided. [5 marks]
(e) Using the frequency distribution table provided, estimate the maximum point difference for which 60% of the bowl games in 2018-2019 fell under. [4 marks]
2. (a) Consider three classes, each consisting of 20 students. From this group of 60 students, a group of 3 students is to be chosen.
i. What is the probability that all 3 students are in the same class? [3 marks]
ii. What is the probability that 2 of the 3 students are in the same class and the other student is in a different class? [3 marks]
(b) In a new casino game, two balls are chosen randomly from an urn containing 8 white, 4 black, and 2 orange balls to see if you will win any money. Suppose that you win $2 for each black ball selected, you lose $1 for each white ball selected, and you get nothing for each orange ball selected. If the casino lets you play this new casino game with no entry fee, what is the probability that you will not lose any money? [7 marks]
(c) A survey was conducted on lawyers at two different law firms about their annual incomes. The following table displays data for the 275 lawyers who responded to the survey.
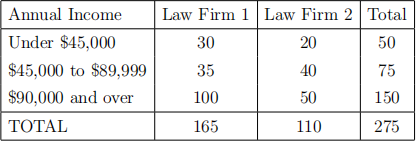
Suppose we choose a random lawyer who responded to the survey. Are the events ”income is under $45,000” and ”employed at Law Firm 2” independent? [4 marks]
(d) A smartphone company receives shipments of smartphones from three factories, labelled, 1, 2 and 3. Twenty-five percent of shipments come from factory 1 whose shipments contain 8% defective smartphones. Sixty-five percent of the shipments come from factory 2 whose shipments contain 6% defective smartphones. The remainder of the shipments comes from factory 3 whose shipments contain 4% smartphones. The company receives a shipment, but does not know the source. A random sample of 15 smartphones is inspected, and three of the smartphones are found to be defective. What is the probability that this shipment came from factory 2? [8 marks]
3. (a) Susan tries to exercise at ”Pure Fit” Gym each day of the week, except on the weekends (Saturdays and Sundays). Susan is able to exercise, on average, on 75% of the weekdays (Monday to Friday).
i. Find the expected value and the standard deviation of the number of days she exercises in a given week. [2 marks]
ii. Given that Susan exercises on Monday, find the probability that she will exercise at least 3 days in the rest of the week. [3 marks]
iii. Find the probability that in a period of four weeks, Susan exercises 3 or less days in only two of the four weeks. [3 marks]
(b) A car repair shop uses a particular spare part at an average rate of 6 per week. Find the probability that:
i. at least 6 are used in a particular week. [2 marks]
ii. exactly 18 are used in a 3-week period. [3 marks]
iii. exactly 6 are used in each of 3 successive weeks. [3 marks]
(c) The breaking strength (in pounds) of a certain new synthetic piece of glass is normally distributed, with a mean of 115 pounds and a variance of 4 pounds.
i. What is the probability that a single randomly selected piece of glass will have breaking strength between 118 and 120 pounds? [2 marks]
ii. A new synthetic piece of glass is considered defective if the breaking strength is less than 113.6 pounds. What is the probability that a single randomly selected piece of glass will be defective? [2 marks]
iii. What is the probability that out of 200 pieces of randomly selected glass, more than fifty-five of them are defective. [5 marks]
4. (a) A sample of 12 of bags of Calbie Chips were weighed (to the nearest gram), and listed here as follows. [9 marks]
219, 226, 217, 224, 223, 216, 221, 228, 215, 229, 225, 229
Find a 95% confidence interval for the mean mass of bags of Calbie Chips.
(b) Professor GeniusAtCalculus has two lecture sections (A and B) of the same 4th year Advanced Calculus (AMA 4301) course in Semester 2. She wants to investigate whether section A students maybe ”smarter” than section B students by comparing their perfor-mances in the midterm test. A random sample of 12 students were taken from section A, with mean midterm test score of 78.8 and standard deviation 8.5; and a random sample of 9 students were taken from section B, with mean midterm test score of 86 and standard deviation 9.3. Assume the population standard deviations of midterm test scores for both sections are the same. Construct the 90% confidence interval for the difference in midterm test scores of the two sections. Based on the sample midterm test scores from the two sections, can Professor GeniusAtCalculus conclude that there is any evidence that one section of students are ”smarter” than the other section? Justify your conclusions. [8 marks]
(c) The COVID-19 (coronavirus) mortality rate of a country is defined as the ratio of the number of deaths due to COVID-19 divided by the number of (confirmed) cases of COVID-19 in that country. Suppose we want to investigate if there is any difference between the COVID-19 mortality rate in the US and the UK. On April 18, 2020, out of a sample of 671,493 cases of COVID-19 in the US, there was 33,288 deaths; and out of a sample of 109,754 cases of COVID-19 in the UK, there was 14,606 deaths. What is the 92% confidence interval in the true difference in the mortality rates between the two countries? What can you conclude about the difference in the mortality rates between the US and the UK? Justify your conclusions. [8 marks]
****END****
Formula sheet
1. Sample Statistics:
|
|
Ungrouped data
|
Grouped data
|
|
Arithmetic Mean
|
 |
 |
|
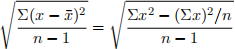
Standard Deviation
|
 |
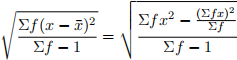 |
2. Probability Distributions:
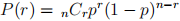
(a) Binomial
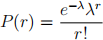
(b) Poisson
3. Standard Errors:
(a) Mean

(b) Proportion

(c) Difference between means

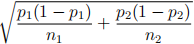
(d) Difference between proportions
4. Test Statistics:
(a)
(one sample)
(two samples)
(b)
(one sample)
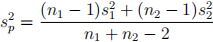
(two samples) where
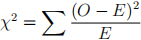
(c)
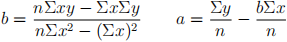
5. Correlation and Regression:
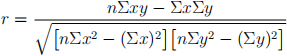
(a) Product moment correlation coefficient
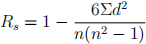
(b) Spearman’s rank correlation coefficient
(c) Least squares regression line y = a + bx