关键词 > Python代写
Project #2: Convex Hull (Divide and Conquer)
发布时间:2021-03-25
Project #2: Convex Hull (Divide and Conquer)
Framework: Download the provided framework to get started and allow you to focus on the primary tasks of the project. In the framework you will find:
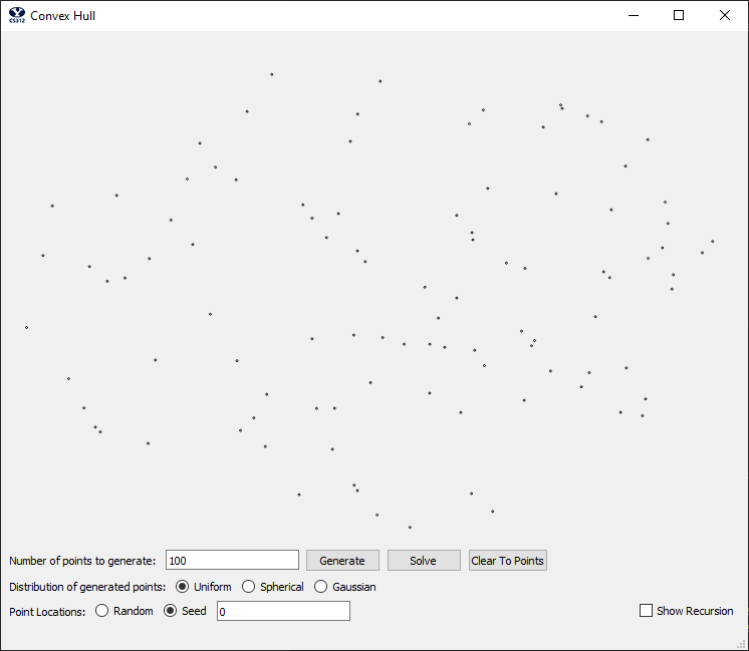
1. A Graphical User Interface that generates a specified number of random points (see image above). The software has been built so that no two points should have the same x value, though there could be duplicate y values. This just makes life a little easier, as otherwise you would have to make sure your software properly deals with duplicate x value points. The GUI is provided in the file Proj2GUI.py.
2. A hook (the "Solve" button) which calls the method that you are going to implement. If you look in the file convex_hull.py, you will find three parts of the compute_hull() method that you need to implement. First, you will need to sort the list of points (QPointF objects) by ascending x-value. Next you will implement your divide and conquer convex hull algorithm (you may create other methods and/or classes if you wish to do this). Last, you will pass a list of QLineF objects representing the segments on the convex hull to the GUI for display (see "dummy" example provided with the code).
Instructions:
1. Write the full, unambiguous pseudo-code for your divide-and-conquer algorithm for finding the convex hull of a set of points Q. Your implemented algorithm must be the nlogn algorithm we presented in class and in the slides. Be sure to label the parts of your algorithm. Also, label each part with its worst-case time efficiency.
2. Analyze the whole algorithm for its worst-case time efficiency to verify the nlogn Big-O asymptotic bound. Discuss how this relates to the Master Theorem estimate for runtime.
3. Implement your divide and conquer algorithm in Python in the following method:
a. ConvexHullSolver.compute_hull( self, unsorted_points )
b. Find the convex hull of the points in pointList.
c. You may use the GUI method addLines() to draw the line segments of the convex hull on the UI once you have identified them.
4. Conduct an empirical analysis of your algorithm by running several experiments as follows:
a. For each value n ∈ {10, 100, 1000, 10,000, 100,000, 500,000, 1,000,000}
i. Generate 5 sets of n points (x,y) in the plane. You may use either the provided point Gaussian distribution or uniform distribution generator. For every point, x and y are real numbers (doubles). You may use the provided project scaffold code to assist you.
ii. For each point set,
1. find the convex hull
2. record the elapsed time
iii. For each size n, compute the mean time t required.
b. Plot n (independent variable) versus t (dependent variable). Note that if you use a logarithmic graph to fit the data (preferable) then that may change the expected shape of your distribution. Make sure you explain that.
5. Find the relation of your plot to your theoretical analysis. In other words, if your theoretical analysis says that for a set of n points Q, the convex hull CH(Q) ∈ O(g(n)), does g(n) actually fit your empirical data? If so, what is the constant of proportionality k so that CH(Q) = k·g(n)? If not, then which function g(n) best fits your empirical data, and what is the constant of proportionality? You can fit a function analytically using software or by trial and error in a spreadsheet, for example.
6. If your theoretical and empirical analyses differ, discuss the reason(s) for the difference.
Report: 90 points total. The other 10 come from your design experience.
1. [40] Correct functioning code to solve the Convex Hull problem using the divide and conquer scheme presented in class.
2. [15] Explain the time and space complexity of your algorithm by showing and summing up the complexity of each subsection of your code Also, include your theoretical analysis for the entire algorithm including discussion of the recurrence relation.
3. [15] Include your raw and mean experimental outcomes, plot, and your discussion of the pattern in your plot. Which order of growth fits best? Give an estimate of the constant of proportionality. Include all work and explain your assumptions.
4. [10] Discuss and explain your observations with your theoretical and empirical analyses, including any differences seen.
5. [10] Include a correct screenshot of an example with 100 points and a screenshot of an example with 1000 points.
