关键词 > Python代写
Scientific Computation Spring 2021 Project 2 (version 1.0)
发布时间:2021-03-01
Scientific Computation
Spring 2021
Project 2 (version 1.0)
Due: Monday March 8th 12:00pm GMT (noon)
There are three main files for this assignment: 1) the one that you are reading which is the project description, 2) project2.py, a Python module which you will complete and submit on Blackboard (see below for details) and 3) report2.tex, a template file for your report which will also be submitted on Blackboard. The discussion and figure(s) described below should be placed in this report.
Part 1
1. (3 pts) You have been provided with the function func1 in project1.py. Provide a clear description of the functionality of func1. Include a clear explanation of how the function’s output is created. Also provide an analysis of the function’s efficiency including an estimate of its asymptotic running time.
2. You will now analyze the propagation of information through an online social net-work. A discrete piece of information is assigned a quality score, q, with 0 < q ≤ 1, which determines how easily it can move through the network. Each node in the network is assigned a filter score: Fi is the filter score for node i and 0 ≤ Fi ≤ 1. Information can only successfully reach node i or be shared by node i if q ≥ Fi.
Network data is provided via an N-element adjacency list, Alist. Nodes are num-bered from 0 to N - 1, and the ith element of Alist is a list with two elements. The 1st element is Fi , and the second element is a list containing the neighbors of node i.
(a) (2 pts) Develop an an efficient algorithm to find the length of the shortest feasible route via which information with quality, q, can successfully propagate from user u1 to user u2. Here, q, u1, u2, and Alist are all provided as input. Complete the function findRoute in project2.py so it determines the length of the shortest feasible route between the given users (if such a route exists). Here route length corresponds to the total number of users on the route, so, if there is a feasible route between u1 = 5 and u2 = 12 via users 3 and 7 (in that order) and there are no routes with 3 or less users, the function should return 4. Return -1 if no feasible route exists. Add a clear description of your implementation to your report.
(b) (4 pts) Now, develop an efficient algorithm to determine the smallest infor-mation quality, qmin with which information can successfully reach user u2 starting from user u1. Here, u1, u2, and Alist are all provided as input. Com-plete the function find qmin so that it finds both qmin and a feasible route from user u1 to u2 with q = qmin (if a route exists). The function should return both qmin‘ and the computed route (see the function documentation). If no feasible route exists for any q, return qmin = - 1 and an empty list for the route. Add a clear description of your implementation to your report.
Note for part 1
You may use the collections and heapq modules for question 2. Please do not import/use other modules without permission.
Part 2
In Part 2, you will develop codes to simulate the the spread of an infectious disease through a network of N communities. Each node corresponds to a community charac-terized by: xi(t), the ratio of the the number in community i who are infected and the original population of the community; similarly, si(t) is the fraction of people who are susceptible with respect to the original population in community i. People may also be recovered so initially, xi + si + ri = 1. The governing equations are,
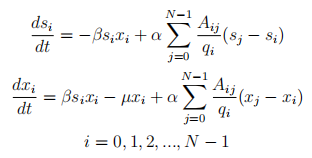
Here, Aij is the adjacency matrix for an N-node undirected connected graph with nodes numbered from 0 to N - 1, qi is the degree of node i, and α, β, and µ are model parameters which must be specified. The initial condition should correspond to only one specified node containing infectious people,xk(t = 0) = x0, and all other nodes should have sj (t = 0) = 1.
1. (4 pts) You will now develop the function, model1, so that it computes a numerical solution for this model on a network provided as input in the form of a networkx graph. The timespan of the simulation and other model parameters are also pro-vided as input – see the documentation in project2.py.
(a) Complete the function, RHS, so that it efficiently computes and returns the right-hand side of the model equations (see the function docstring). You should assume that RHS will be called a very large number of times within one call to meme1 and construct your code accordingly. You should also design your code for very large networks, say, N = 1e4 or larger, though it is recommended that you develop and test your code with much smaller graphs. Note that variables set “above” RHS will be available within RHS. Add a brief explanation to your report explaining how you have designed your function and why it can be considered to be efficient.
(b) Add the needed code below RHS to efficiently and accurately simulate the model for Nt time steps from t = 0 to t = tf with the initial condition set as described above. The function should return an array containing s and x for each node at each time step (including the initial condition).
2. (3 pts) Now consider the following stochastic model for disease spread through the network via random walks. One step of a random walk for a walker at node i at time t is defined as follows. A neighbor of node i is chosen uniformly at random and the walker moves to this node at t + ∆t. In this model, each node of the graph will initially have M walkers, and code to simulate these random walks has been provided in model2. Examine the code, check that you can run it and visualize the output. Disease spread takes place within each community prior to the walkers moving to neighboring nodes. Each walker is either susceptible (Si(t) = 1) or infectious (Si(t) = 0). Each time step, the probability of a susceptible walker on node i at time t becoming infectious at t+∆t is β∆tγi(t) where γi is the fraction of walkers on node i that are infectious. Initially, all walkers are susceptible except x0 walkers on node k. Add code to model2 so that it efficiently simulates this model and returns the state of each walker at each time step. Add a brief description of your code to your report.
3. (4 pts) For this question, set µ = 0 in model1, and investigate the spread of disease from node 0 on a Barabasi-Albert graph with n = 200, m = 4 (see the documenta-tion for nx.barabasi albert graph) using model1. Your analysis should identify and explain 2-4 key trends and should be supported by well-made figures. An exhaus-tive investigation of the parameter space is not needed, but you should consider a few different values of both α and β. Add your analysis and figures to your report. Add the code used to generate your figures to the function analyze.
Are the dynamics generated by model2 at all similar to those you have observed for model1 ? Place your reasoning, conclusions, and supporting figures in your report. Include the code used to generate your figures in analyze. You should consider varying β∆t to help you answer this question.
Note: while you should attempt to go beyond simple or vague qualitative descrip-tions of computational results, in-depth mathematical analysis of the models is not expected.
Note for Part 2: You may use numpy, scipy, matplotlib, and networkX for part2. Do not use any other modules without permission.
Further guidance
• You should submit both your completed python file and a pdf containing your dis-cussion and figure(s). You are not required to use the provided latex template, any well-organized pdf is fine. To submit your assignment, go to the module Blackboard page and click on“Project 2”. There will be an option to attach your files to your submission. (these should be named project2.py and report2.pdf). After attaching the notebook, submit your assignment, and include the message, “This is my own work unless indicated otherwise.” to confirm the work as your own.
• Please do not modify the input/output of the provided functions without permis-sion. You may create additional functions as needed, and you may use any code that I have provided during the term.
• Marking will be based on the correctness of your work, the soundness of your analysis, and the degree to which your submission reflects a good understanding of the material covered up to the release of this assignment. You should aim to keep the pdf version of your report to less than 8 pages (with 10 or less figures), however you will not be penalized if you exceed this guidance.
• Open-ended questions require sensible time-management on your part. Do not spend so much time on this assignment that it interferes substantially with your other modules. If you are concerned that your approach to the assignment may require an excessive amount of time, please get in touch with the instructor.
• Questions on the assignment should be asked in private settings. This can be a “private” question on Piazza (which is distinct from “anonymous”), using the “Chat” on Teams during a Q&A session, or by arrangement with the instructor.
• Please regularly backup your work. For example, you could keep an updated copy of your files on OneDrive.
• In order to assign partial credit, we need to understand what your code is doing, so please add comments to the code to help us.
• You have been asked to submit code in Python functions, but it may be helpful to initially develop code outside of functions so that you can easily check the values of variables in a python terminal.
