关键词 > R代写
Assignment
发布时间:2021-01-25
Please have your name, student number, and your tutor’s name clearly displayed on the first page.
Instructions: Questions labelled with ‘(R)’ require use of R. Please provide appropriate R commands and their output, along with sufficient explanation and interpretation of the output to demonstrate your understanding. Such R output should be presented in an integrated form together with your explanations. All other questions should be completed without reference to any R commands or output, except for looking up quantiles of distributions where necessary. Make sure you give enough explanation so your tutor can follow your reasoning if you happen to make a mistake. Please also try to be as succinct as possible. Each assignment will include marks for good presentation.
1. (R) An interior automotive supplier places several electrical wires in a harness. A pull test measures the force required to pull spliced wires apart. A customer requires that each wire that is spliced into the harness withstand a pull force of 20 pounds. Let X be a random variable representing the pull force required to pull a spliced wire apart.
The following are 20 observations of X:
28.8 24.4 30.1 25.6 26.4 23.9 22.1 22.5 27.6 28.1
20.8 27.7 24.4 25.1 24.6 26.3 28.2 22.2 26.3 24.4
(a) Give basic summary statistics for these data and produce a box plot. Briefly comment on center, spread and shape of the distribution.
(b) Assuming a normal distribution (with unknown mean and variance), compute maximum likelihood estimates for the parameters.
(c) Draw a density histogram and superimpose a pdf for a normal distribution using the estimated parameters.
(d) Draw a QQ plot to compare the data against the fitted normal distribution. Include a reference line. Comment on the fit of the model to the data.
(e) Assume a normal distribution (with unknown mean and variance) for X. Find a one-sided 95% confidence interval that is a lower bound for the mean of X, and answer the question that whether the supplier meets the customer’s requirement.
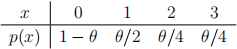
2. Let  be a random sample from a discrete distribution with the following pmf:
(a) (i) Find
(
) and var(
(ii) Find the method of moments estimator (MME)

(iii) Is
unbiased for
? Explain why or why not.
(iv) Find the variance of
(b) Let
denote the sample frequencies of 0, 1, 2 and 3, respectively.

(i) Find the likelihood function in terms of
(ii) Show that the maximum likelihood estimator (MLE) of
Hint: use the fact that

(iii) Find the sampling distribution of

(iv) Is
unbiased for
(v) Find the variance of
(vi) Find an approximate 95% confidence interval for
3. Let be a random sample from the inverse Gaussian distribution, IG(µ, λ), whose pdf is:
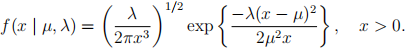
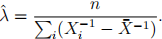
(a) Show that the MLE of µ and λ are
and
(b) It is known that
Use this to derive a 100 · (1 - α)% CI for λ.
(c) (R) Consider the following dataset:
10.6, 91.3, 51.7, 2.2, 3.8, 6.0, 17.8, 131.8, 31.0, 4.2,
13.7, 10.2, 9.9, 4.3, 5.6, 12.9, 42.0, 14.1, 3.8, 9.3,
2.6, 27.6, 1.7, 7.0, 2.1, 1.5, 7.5, 2.5, 2.4, 51.9
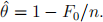
(i) Assuming an inverse Gaussian distribution is an appropriate model for these data, compute the maximum likelihood estimate of λ and give a 95% CI for λ.
(ii) Draw a QQ plot to compare these data to the fitted inverse Gaussian distri-bution, IG(
). Is this model appropriate for these data?
Hint: Quantiles for the inverse Gaussian distribution may be computed using the qinvgauss function in the statmod R package.
4. Let be a random sample from Uniform(0, ) with an unknown endpoint > 0. We want to estimate the parameter .
(a) Find the method of moments estimator (MME) of
(b) Find the mean, variance and mean square error (MSE) of the MME in (a).
(c) Find the maximum likelihood estimator (MLE) of
(d) Find the sampling distribution of the MLE in (c).
(e) Find the mean, variance and mean square error (MSE) of the MLE in (c).
(f) (R) Set the sample size as 35, do a simulation (simulate from the Uniform(0, 1) distribution) in R to compare these two estimators in terms of their bias and vari-ance. Include a side-by-side boxplot that compares their sampling distributions.
5. To determine the effect of 100% nitrate on the growth of pea plants, several specimens were planted and then watered with 100% nitrate every day. At the end of two weeks, the plants were measured. Here are data on seven of them:
17.5 14.5 15.2 14.0 17.3 18.0 13.8
Assume that these data are a random sample from a normal distribution N( ).
).
(a) Find the value of point estimates of µ and
.
(b) Find a 95% confidence interval for µ.
(c) Find a 90% confidence interval for
6. Twenty-four 9th- and 10th-grade high school girls were put on an ultraheavy rope-jumping program. The following data give the time difference for each girl (“before program time” minus “after program time”) for the 40-yard dash:
0.28 0.01 0.13 0.33 -0.03 0.07 -0.18 -0.14 -0.33 0.01 0.22 0.29
-0.08 0.23 0.08 0.04 -0.30 -0.08 0.09 0.70 0.33 -0.34 0.50 0.06
Find a one-sided 95% confidence interval that is a lower bound for  , the mean of the difference in race times.
7. Independent random samples of the heights of adult males living in two countries yielded the following results:  ,
,  inches,
  inches and
  ,
,  inches,
  inches.
(a) Assume that
, fifind a 95% confidence interval for the difference
of the means of the populations of heights.
(b) Assume that
, find an approximate 95% confidence interval for the difference
8. A machine shop manufactures toggle levers. A lever is flawed if a standard nut cannot be screwed onto the threads. Let p equal the proportion of flawed toggle levers that the shop manufactures. If there were 24 flawed levers out of a sample of 642 that were selected randomly from the production line.
(a) Give a point estimate of p.
(b) Find an approximate 95% confidence interval for p.
