关键词 > AAE/ECON474
AAE/ECON 474 Practice Problems
发布时间:2022-02-15
Hello, dear friend, you can consult us at any time if you have any questions, add WeChat: daixieit
AAE/ECON 474
Practice Problems
1. In Table 1 below, divide column “Estimated value” by column “Standard error”. This answer will give you the t-stat for the null hypothesis that the true value is zero.
a. Check whether your answer corresponds to the values in column “t-stat”. If this value is above 1.96 (approximately 2), you reject the null with 95% confidence.
b. You can also test the null hypothesis that the estimated value is different than the true value (reported in column “True value”; recall that these data have been simulated using “True value”). What would the t-stat be? Can you reject the null with 95% confidence?
c. If School is measured in terms of years of schooling and the outcome variable is measure in terms of annual salary in $US, what is the estimated effect of an individual increasing years of schooling by one year?
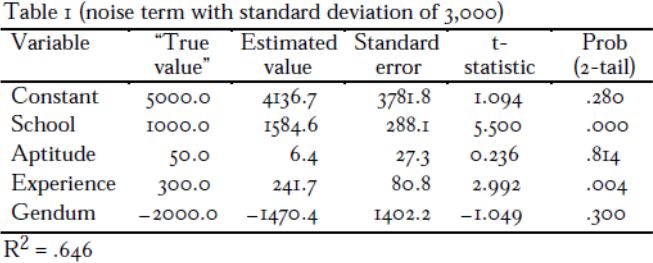
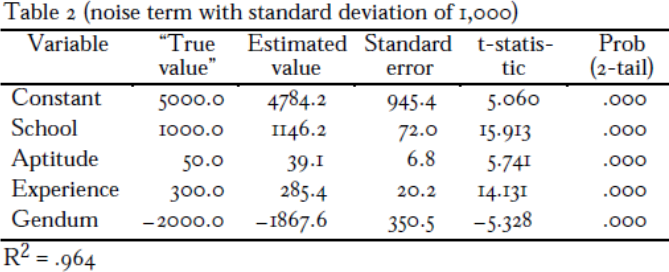
2. Select a variable and compare the “Estimated value” and “Standard error” in Table 1 and Table 2 (below).
a. What differences do you notice? What do you think is driving this difference?
b. Now look at the R-squared in both tables. What does R-squared mean? Explain why it is smaller in Table 1 in words.
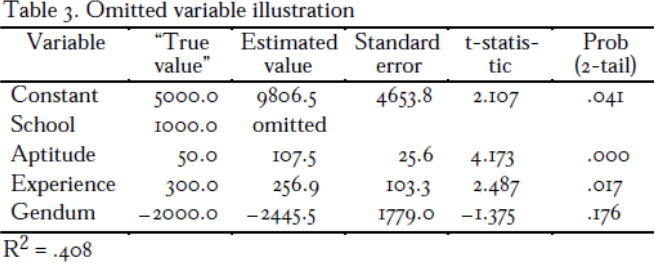
3. Compare the “Estimated value” and “Standard error” of the variable Aptitude in Table 1
and Table 3 (below).
a. What differences do you notice?
b. What about the statistical significance (this means that we can reject the null hypothesis that the coefficient is equal to zero) of this variable in each table?
c. Using the variable School, explain in words why you observe these differences in estimation of the effect of Aptitude.
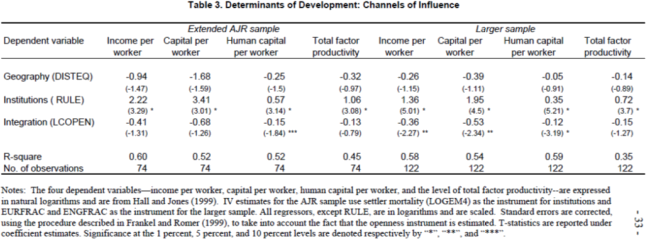
4. Interpreting regression output in an academic paper.
The following table shows a series of regressions relating geography, institutions, and economic integration to important development outcomes: income per worker, capital per worker, human capital per worker, and “total factor productivity”, which is sort of a measure of efficiency in an economy. Bigger means better for all of these measures. Income per worker is a measure of output, and capital per worker and human capital are measures of investment in physical and human capital (like education). Geography is measured by distance to the equator (this is a measure inspired by Sachs), institutions are measured by a Rule of Law index which has been popular in the economics literature. Higher values of rule correspond to greater “rule of law” or better institutions in a country. Finally, integration is measured by the natural logarithm of “openness”. Openness is given by the ratio of (nominal) imports plus exports to GDP (in nominal US dollars). It basically means that your country trades a lot relative to its overall income. Note that the dependent variables are measured in natural logs, as are the independent variables, with the exception of the rule of law index.
This analysis comes from a paper entitled “Institutions Rule: the primacy of institutions over geography and integration in economic development” by Dani Rodrik, Arvind Subramanian, and Francisco Trebbi. If you are interested in reading it, I have posted it on the course web page. It is not necessary that you read it to answer this question.
Consider table 3 from this paper.
1. What is the impact of a one unit increase in the rule of law index on income per worker? What is the impact of a one percent change in distance to the equator on income per worker? It is sufficient to discuss the results in the first three columns – the second three columns are simply using a different sample.
2. What is the impact of a one unit increase in the rule of law index on capital per worker? On human capital per worker?