关键词 > Python代写
Peer feedback computing session
发布时间:2022-02-08
Hello, dear friend, you can consult us at any time if you have any questions, add WeChat: daixieit
Peer feedback computing session
Exercise: hot air balloon
The aim of the following exercise is to calculate and plot the trajectory of an hot air balloon in variable winds. The developed Python program will be given to your peer, who will review it and provide you feedback about the correctness of the code and the coding style.
We assume that, at every instant, the hot air balloon moves at the wind speed, which changes with time. The wind velocity vector ⃗v = (vx,vy) during the two hour flight in the x-y plane is saved in the file “VelocityData.csv”. The first column in the file contains a string with the time, the second and third columns contain the components vx and vy of the velocity at the corresponding time. The wind velocity is measured every minute from 9am, when the balloon takes off, to 11am, when the balloon lands, and it is given in miles per hour (mph).
Task
Write a program that imports the velocity data from the file “VelocityData.csv” and calculate the position of the air balloon as a function of time. Let ⃗r (t) = (x(t),y(t)) the position vector at time t in the x-y plane, then time integration can be carried out using:
⃗r (t + dt) = ⃗r (t) + ⃗v (t)dt , (1)
where ⃗v (t) is the velocity at time t and dt is the timestep used for time integration. Choose the appropriate value of the timestep and use as initial position ⃗r (t = 0) = (1.0, 4.9)miles.
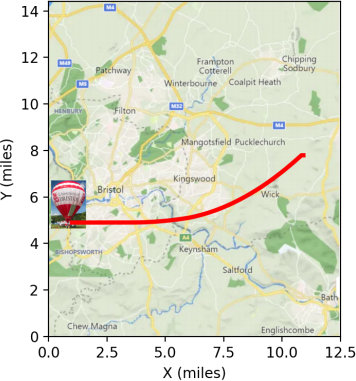
Figure 1: Map, starting position of the balloon and example trajectory. Note: this is just an example trajectory and not the one you will find from the data in “VelocityData.csv”.
The program should plot the trajectory on the map, similar to the one shown in Figure 1, and calculate and print the distance between the starting point and the landing point. In order to plot the map on the background of the figure, use the following commands just after creating the figure object (fig) and axis object (ax):
|
img = plt . imread (”BristolMap . png”) ax . imshow(img , extent =[0 , 12.5 , 0 , 14.41]) |
# miles |
where 12.5 and 14.41 are the dimensions of the map along the x and y axes in miles respectively. The file “BristolMap.png” is provided.
Peer feedback instructions
Check the code of your peer and provide feedback. The following questions can help you evaluate your peer’s code.
❼ Is the final plot correct?
❼ Does the plot include appropriate labels?
❼ Are there comments describing the meaning of the variables?
❼ Are the names of the variables appropriate?
❼ Are there comments describing the operations carried out?
❼ Do you understand clearly what each line of the code does?
❼ Is there an appropriate number of data structures to store the output information?
❼ Are there unused or unnecessary variables or operations?
❼ Is the code flexible enough? Can you easily change the initial position of the air balloon?
❼ Can you easily change the time step? Do you need to modify multiple lines to do that?
❼ Will the code work if the wind speed file has a different number of rows?
