关键词 > CIVE1180
CIVE 1180 TRANSPORT ENGINEERING 1
发布时间:2025-10-13
Hello, dear friend, you can consult us at any time if you have any questions, add WeChat: daixieit
5. Horizontal Alignment:
As per the Austroads Functional Classification our designed road is classified as Class 2 Rural (A Route Classification). The average speed of vehicles passing through the new roads is assumed to be like an two lane- two way Intermediate Speed Rural Road where the Minimum operating speeds on these roads are generally 70–90 km/h. [3.4.2. Austroads Guide to Road Design: Part 3]. However, drivers will accelerate their vehicle if they get the opportunity and the speed may certainly increase up to the desired speed where possible, let’s say 100 km/h.[3.4.2. Austroads Guide to Road Design: Part 3].
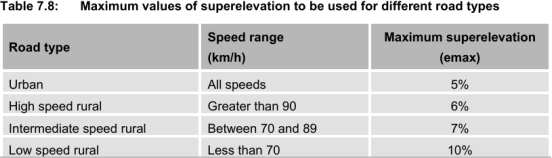
Table: 7.8 [Austroad Guide to Road Design: Part 3]
From the above table, as our road is in the criteria of intermediate speed rural, maximum superelevation 7%.
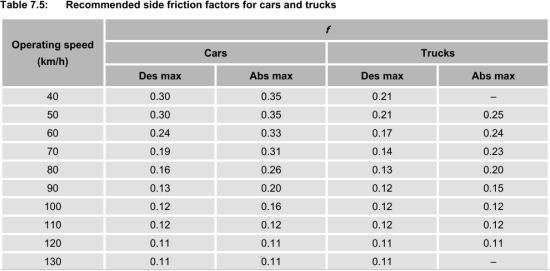
Figure: 7.5 [Austroad Guide to Road Design: Part 3]
Assuming Max Operating Speed to be 100 (km/h), the friction factor coefficient comes 0.16
Calculating Minimum Radius of Curvature:
We know, 
Where,
Design Speed, V = 100 km/h
Maximum Elevation, emax = 7% = 0.07
Friction Factor, fmax = 0.16
We get, 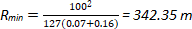
Superelevation, 
From the Excel file we get that for all the curves on the road the calculated superelevation (e) value is negative(-ve). Which means that the curves have enough big radius that there is no need to add superelevation during the design process.
From Part-A, we have that the maximum grade is 5%. Thus, the maximum grade is still granted in all sections. No need to change our optimized route design.
|
Points |
Distance |
Elevation |
Radii |
Angle |
Operating Speed (km/h) |
Progressing distance |
Vertical point |
Grade |
Vertical Point x10 |
|
A |
0 |
225 |
|
|
100 |
0 |
0,225 |
0.00 |
0,2250 |
|
1a |
1292.52 |
233.75 |
|
|
100 |
1292.52 |
1292.52,233.75 |
0.68 |
1292.52,2337.5 |
|
1b |
283.81 |
221.67 |
550 |
27.6 |
100 |
1576.33 |
1576.33,221.67 |
-4.26 |
1576.33,2216.7 |
|
2a |
639.83 |
234.17 |
|
|
100 |
2216.16 |
2216.16,234.17 |
1.95 |
2216.16,2341.7 |
|
2b |
411.82 |
226 |
600 |
39.34 |
100 |
2627.98 |
2627.98,226 |
-1.98 |
2627.98,2260 |
|
3a |
1505.68 |
230 |
|
|
100 |
4133.66 |
4133.66,230 |
0.27 |
4133.66,2300 |
|
3b |
463.96 |
230.3 |
800 |
33.23 |
100 |
4597.62 |
4597.62,230.3 |
0.06 |
4597.62,2303 |
|
4a |
847.64 |
235 |
|
|
100 |
5445.26 |
5445.26,235 |
0.55 |
5445.26,2350 |
|
4b |
362.34 |
239.4 |
1000 |
20.76 |
100 |
5807.6 |
5807.6,239.4 |
1.21 |
5807.6,2394 |
|
5a |
1001.3 |
243.57 |
|
|
100 |
6808.9 |
6808.9,243.57 |
0.42 |
6808.9,2435.7 |
|
5b |
311.25 |
245 |
1000 |
17.83 |
100 |
7120.15 |
7120.15,245 |
0.46 |
7120.15,2450 |
|
6a |
1051.38 |
250 |
|
|
100 |
8171.53 |
8171.53,250 |
0.48 |
8171.53,2500 |
|
6b |
338.09 |
254.37 |
800 |
24.21 |
100 |
8509.62 |
8509.62,254.37 |
1.29 |
8509.62,2543.7 |
|
7a |
748.14 |
273.57 |
|
|
100 |
9257.76 |
9257.76,273.57 |
2.57 |
9257.76,2735.7 |
|
7b |
81.07 |
277.5 |
800 |
5.69 |
100 |
9338.83 |
9338.83,277.5 |
4.85 |
9338.83,2775 |
|
8a |
866.49 |
267.5 |
|
|
100 |
10205.32 |
10205.32,267.5 |
-1.15 |
10205.32,2675 |
|
8b |
179.81 |
271.67 |
600 |
17.17 |
100 |
10385.13 |
10385.13,271.67 |
2.32 |
10385.13,2716.7 |
|
B |
409.42 |
275 |
|
|
100 |
10794.55 |
10794.55,275 |
0.81 |
10794.55,2750 |
|
|
10794.55 |
|
|
|
|
|
|
|
|
Road Width:
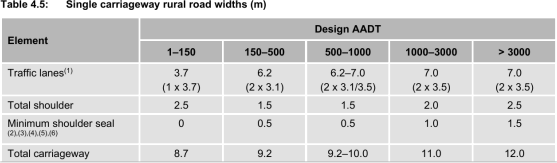
Lets Consider, Annual Average Daily Traffic is ranged from 500-1000.
Traffic Lane = 3.5 x 2 = 7 m
Total Shoulder = 1.5 m each side x 2 = 3.0 m
Total Width of the Road = 7+3 m = 10 m
