关键词 > ECON2300
ECON2300 Homework 4
发布时间:2025-09-24
Hello, dear friend, you can consult us at any time if you have any questions, add WeChat: daixieit
ECON2300
Homework 4
1. (MGH CH2 Exercise 12) The Quick Change Oil Company has a number of outlets in the metropolitan Seattle area. The daily number of oil changes at the Oak Street outlet in the past 20 days are:
|
65 |
98 |
55 |
62 |
79 |
59 |
51 |
90 |
72 |
56 |
|
70 |
62 |
66 |
80 |
94 |
79 |
63 |
73 |
71 |
85 |
The data are to be organized into a frequency distribution.
a. How many classes would you recommend?
b. What class interval would you suggest?
c. What lower limit would you recommend for the first class?
d. Organize the number of oil changes into a frequency distribution.
e. Comment on the shape of the frequency distribution. Also, determine the relative frequency distribution.
2. (MGH CH2 Exercise 18) A large Internet retailer is studying the lead time (elapsed time between when an order is placed and when it is filled) for a sample of recent orders. The lead times are reported in days.

a. How many orders were studied?
b. What is the midpoint of the first class?
c. What are the coordinates of the first class for a frequency polygon?
d. Draw a histogram.
e. Draw a frequency polygon.
f. Interpret the lead times using the two charts.
3. (MGH CH2 Exercise 22) The frequency distribution of order lead time of the retailer from Exercise 18 is repeated below.
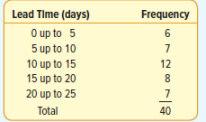
a. How many orders were filled in less than 10 days? In less than 15 days?
b. Convert the frequency distribution to cumulative frequency and cumulative relative frequency distributions.
c. Develop a cumulative frequency polygon.
d. About 60% of the orders were filled in less than how many days?
4. The following data represent the number of cars that arrived at a McDonald’s drive-through between 11:50 a.m. and 12:00 noon each Wednesday for the past 50 weeks:
1 7 3 8 2 3 8 2 6 3
6 5 6 4 3 4 3 8 1 2
5 3 6 3 3 4 3 2 1 2
4 4 9 3 5 2 3 5 5 5
2 5 6 1 7 1 5 3 8 4
(a) Construct a frequency distribution of the data.
(b) Construct a relative frequency distribution of the data.
(c) Construct a cumulative frequency distribution of the data.
(d) Construct a cumulative relative frequency distribution of the data.
(e) Construct a frequency histogram of the data. Describe the shape of the distribution.
(f) Construct a relative frequency histogram of the data.
(g) What percentage of weeks did exactly three cars arrive between 11:50 a.m. and 12:00 noon?
(h) What percentage of weeks did three or more cars arrive between 11:50 a.m. and 12:00 noon?
