关键词 > SOST20131/30031
SOST20131/30031 Answering Social Research Questions with Statistical Models 2021
发布时间:2022-01-12
Hello, dear friend, you can consult us at any time if you have any questions, add WeChat: daixieit
SOST20131/30031 Answering Social Research Questions with Statistical Models 2021
Assessment part 2
Lack of physical activity and depression
Major clinical depression can be a severely debilitating illness, but even mild depressive episodes can severely affect quality of life. Roshanaei-Moghaddam et al. (2009) reviewed the relationship between physical activity and depression. There is certainly a negative correlation between physical activity and depression, such that lower levels of activity are associated with higher levels of depression and vice versa, but it is unclear as to the size of the causal relationship. For example, there may be confounding factors, such as attributes of individuals that make them both more likely to engage in physical activity and less likely to suffer depression.
In an effort to disentangle spurious from causal effects, you have decided to analyse data from the English Longitudinal study of Ageing (ELSA). This study surveyed a sample of English householders aged 50 or more, across multiple occasions, two years apart. The first occasion, or wave, was in 2002 and the second wave was in 2004.
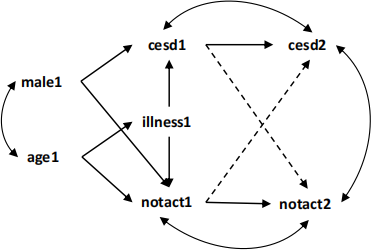
Figure 1: Directed Acyclic Graph of the hypothesised causal relationships
between lack of physical activity (notact1 & notact2) and depression
(cesd1 & cesd2) across two waves of ELSA.
Data
The variables shown in Figure 1 were measured in ELSA. These variables are described in Table 1, below. These data are contained in the file “elsa12wide.csv”. The key relationships you wish to analyse are shown by the arrows drawn with dashed lines in Figure 1.
Table 1: Variables from the DAG in Figure 1, as measured in the English Longitudinal Study of Ageing (ELSA), in the file “elsa12wide.csv” .
|
Variable |
Description |
Coding |
|
0. id |
Unique identifying label for each respondent |
arbitrary numerical label |
|
1. age1 |
Chronological age in wave 1 (2002) |
Years since birth |
|
2. male1 |
Biological sex in wave 1 |
Male = 1, female = 0 |
|
3. illness1 |
Limiting longstanding illness, self-declared in wave 1 |
Has illness = 1, no illness = 0 |
|
4. cesd1 |
Centre for Epidemiological Studies’ Depression (cesd) scale score, wave 1 |
Score from 0 to 8 (higher score = more depressed) |
|
5. cesd2 |
as above, in wave 2 (2004) |
as above |
|
6. notact1 |
Self-declared lack of moderate physical activity at least once a week, in wave 1 |
1 = no moderate physical activity at least once a week, 0 = at least some moderate physical activity |
|
7. notact2 |
as above, in wave 2 |
as above |
Questions to answer
Use the R package and the data contained in “elsa12wide.csv” to carry out these tasks and answer these questions.
1. Fit a model for the unconditional effect of notact1 -> cesd2 (i.e. a model with cesd2 as the outcome and notact1 as the sole predictor, and no additional “third” variables).
a. Discuss the statistical and substantive meaning of the estimated model results (e.g. b parameters & SEs, p-values, R-square, whether it is likely a causal effect). [6 marks]
b. Discuss the assumptions of this model (causal and statistical), and how they affect what you can conclude about the relationship between physical activity and depression in the study population. [6 marks]
2. Based upon the DAG in Figure 1, specify and fit a model to evaluate the total causal effect of notact1 -> cesd2.
a. Explain the reasoning behind your choice of model specification, i.e. which variables did you choose to include as additional predictors in the model, if any. [10 marks]
b. Discuss the changes in the estimated model results (e.g. b parameters, SEs, p-values, R-square), and their statistical and substantive meanings. [10 marks]
c. Discuss the assumptions of this model (causal and statistical), how they differ from those you discussed in 1.b. above, and how they affect what you can conclude about the relationship between physical activity and depression in the study population. [8 marks]
3. Fit a model for the unconditional effect of cesd1 -> notact2 (i.e. a model with notact2 as the outcome and cesd1 as the sole predictor, and no additional “third” variables).
a. Discuss the statistical and substantive meaning of the estimated model results (e.g. b parameters, SEs, p-values, R-square). [10 marks]
b. Discuss the assumptions of this model (causal and statistical), and how they affect what you can conclude about the relationship between depression and physical activity in the study population. [5 marks]
4. Based upon the DAG in Figure 1, specify and fit a model to evaluate the total causal effect of cesd1 -> notact2.
a. Explain the reasoning behind your choice of model specification, i.e. which variables did you choose to include as additional predictors in the model, if any. [10 marks]
b. Discuss the changes in the estimated model results (e.g. b parameters, SEs, p- values), and their statistical and substantive meaning. [10 marks]
c. Discuss the assumptions of this model (causal and statistical), how they differ from those you discussed in 3.b. above, and how they affect what you can conclude about the relationship between physical activity and depression in the study population. [10 marks]
5. Consider together the models from questions 2. and 4. Did you use the same predictor variables in each model or different ones, and why? How did they vary in terms of model fit? When viewed together, what do the results from these models tell us about the relationship between physical activity and depression in the study population? [15 marks]
Copy/past the R script that you used to run the models for the questions above into an appendix of your submission. [You will not be graded on the correctness of this appendix. Marks will neither be awarded nor penalized for your R code. Rather it will be used to help in the understanding your models and results. Failure to include an R appendix will result in a penalty of 10 marks.]
Guidance notes
![]() Your submission should answer each of the 5 questions above.
Your submission should answer each of the 5 questions above.
![]() You should use the models we discussed in class to answer the questions, i.e. a linear model (a.k.a. linear regression, multiple linear regression, general linear model) or a binary logistic model (a.k.a. logistic regression, generalized linear model). Different questions may require different models, so be sure to mention briefly which model you chose and why.
You should use the models we discussed in class to answer the questions, i.e. a linear model (a.k.a. linear regression, multiple linear regression, general linear model) or a binary logistic model (a.k.a. logistic regression, generalized linear model). Different questions may require different models, so be sure to mention briefly which model you chose and why.
![]() Good answers are those that clearly address all parts of the question.
Good answers are those that clearly address all parts of the question.
![]() Use descriptive statistics and/or derived quantities (such as model-predicted values) to support and justify your answers, where this will help you to answer the question clearly.
Use descriptive statistics and/or derived quantities (such as model-predicted values) to support and justify your answers, where this will help you to answer the question clearly.
![]() You may re-code, centre, and / or derive new variables if it will help you answer the questions. Be sure to clearly describe and justify any such manipulation of the data.
You may re-code, centre, and / or derive new variables if it will help you answer the questions. Be sure to clearly describe and justify any such manipulation of the data.
![]() Your answers to questions 2.b. and 4.b. will be marked without regard to whether you answered questions 2.a. and 4.a. correctly, i.e. even if you got questions 2.a. or 4.a. wrong, it is still possible to get full marks for questions 2.b., 4.b.
Your answers to questions 2.b. and 4.b. will be marked without regard to whether you answered questions 2.a. and 4.a. correctly, i.e. even if you got questions 2.a. or 4.a. wrong, it is still possible to get full marks for questions 2.b., 4.b.
![]() Supporting and justifying your answers with references to books and articles in the course reading lists, and other scholarly material, is encouraged and will help contribute to a higher mark. Provide a full reference for any work that you do cite. Include no more than 7 citations in your answer.
Supporting and justifying your answers with references to books and articles in the course reading lists, and other scholarly material, is encouraged and will help contribute to a higher mark. Provide a full reference for any work that you do cite. Include no more than 7 citations in your answer.
![]() The word limit for your submission is 1,800 words. Note that this is a limit, not a target; you are permitted to use fewer than 1,800 words, but not more.
The word limit for your submission is 1,800 words. Note that this is a limit, not a target; you are permitted to use fewer than 1,800 words, but not more.
![]() The word limit includes all of the words in the main text of your answer, including headings, table, and figures, but does not include references or the R appendix. (You do not need to repeat the full text of the questions above in your answer. Simply putting e.g. Q1.a., Q1.b., will be fine.)
The word limit includes all of the words in the main text of your answer, including headings, table, and figures, but does not include references or the R appendix. (You do not need to repeat the full text of the questions above in your answer. Simply putting e.g. Q1.a., Q1.b., will be fine.)
![]() Submit your report via the Turnitin portal on Blackboard – follow the links to “submit your
Submit your report via the Turnitin portal on Blackboard – follow the links to “submit your
work here” in the “Assessment” section.
