关键词 > Math3772/5772
Math 3772/5772 Checksheet for Jan 2020 exam
发布时间:2022-01-10
Hello, dear friend, you can consult us at any time if you have any questions, add WeChat: daixieit
Math 3772/5772 Checksheet for Jan 2020 exam
Q1 (b) 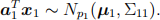
(c) (i) 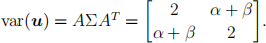
(ii) Since α = 0.5 = _β , α + β = 0 and so u1 and u2 are independent. Hence  since u1 ~ N(0, 2).
Q2 (c) (i) If u = 0, then the new drug has no effect on blood pressure.
(ii)  From the table, the upper 5% critical value is
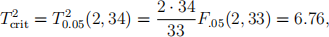
so the null hypothesis is strongly rejected.
(iii) The SCIs take the form 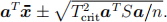
For a = (1 0)T we get _3 ± 4.40, which includes 0.
For a = (0 1)T we get _3 ± 2.20, which excludes 0.
Hence the new drug seems to reduce diastolic blood pressure but not systolic blood pres- sure.
Q3 (c) (i) By changing the signs of 3 variables, it has been possible to produce a correlation matrix, all of whose elements are positive. All the new variables seem positively associated with the “size” of the car.
(ii) The first eigenvalue accounts for 70% of the total variation and the first two for 89%. Two rules of thumb are 50% or 90% suggesting k = 1 or k = 2 PCs are needed to adequately summarize the variability in the data.
PC1 = average of all 6 new variables — seems to be a measure of the “size” of the car PC2 = contrast between new variables 3,6 and new variables 4,5, — perhaps a measure of the “power” of the car.
(iii) [Level 3] The different variables are in different units, which implies PCA on the covariance matrix has no natural meaning.
(iii) [Level 5] If the statistician had not changed the signs of any of the variables, then the eigenvalues would not change. Rows 1,4,6 of Gamma would change sign, but the overall interpretation of PCA would be unchanged.
Q4 (b) If Π 1 : Np (u1 , Σ) and Π2 : Np (u2 , Σ), the allocation region to Π 1 under the maximum likelihood rule takes the form

If u1 = u, u2 = 2u, this simplifies to

(c) (i) Resubstitution: create an allocation rule from the whole data set and apply it to each observation in turn;
Cross-validation: create an allocation rule from the reduced data set (excluding observa- tion r) and use it to allocate observation r; repeat for r = 1, . . . , n.
(ii) RS rule suggests very accurate classification
CV suggests the allocation is nearly random.
That is, the RS rule seems to be overfitting the data (since n is not much greater than p). CV seems more reliable and suggests the questionnaire has little predictive power.
(iii) For the future perhaps use a smaller p or a larger n.
Q5. [Level 5 only]
(b) (i) If λj , j = 1, . . . , 7 denote the eigenvalues and Γ denotes the standardized eigenvec- tor matrix, then the 7 points in the figure have coordinates given by rescaling the columns of Γ, i.e., 
(ii) Let  denote the proportion of total variation given by the first k eigenvalues (assuming λk > 0). Then ρ 1 = 48%, ρ2 = 83%, ρ3 = 96%, suggesting k = 1 is too small, k = 2 is probably OK, but may miss some small features, and k = 3 is definitely OK.
(iii) Some possible interpretations:
E (moth) is a long way from all the vertebrates (as expected)
C (man) is a long way from the other vertebrates (surprising),
B and F (tuna and donkey) are very close (surprising),
A and D (turtle and chicken) are very close (perhaps not too surprising since birds evolved from reptiles).
