关键词 > Fin/Econ代写
Financial Economics and Capital Markets Solutions Seminar 2
发布时间:2022-01-10
Hello, dear friend, you can consult us at any time if you have any questions, add WeChat: daixieit
Financial Economics and Capital Markets
Solutions
Seminar 2
Exercise 1
a) A project generates a sequence of cash flows as follows
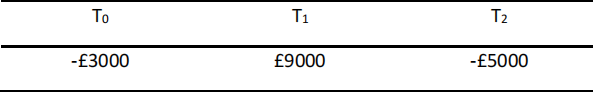
Calculate the IRR of the project, and explain the difficulties with the IRR method in this case.
Solution
• Define the IRR
• NPV(IRR)=0 -> £3000=£9000/(1+IRR)-£5000/(1+IRR)2 -> IRR=1.26, OR -0.26 (these are not in percentages)
• Explain that when cash flows change sign more than once, there is potentially a problem of multiple IRRs
b) Explain why, if two projects are mutually exclusive, conflict may arise between NPV and IRR methods. If conflict exists, how should the capital budgeting decision be made?
Solution
• Explain why the IRR may cause problems when choosing between mutually exclusive projects that differ in scale, timing and risk
• Explain that when conflict exists we should always trust NPV method and why.
c) Explain the delayed investment problem and its impact on IRR method.
Solution
• Define the standard IRR rule
• Define what is a delayed investment problem
• Explain that for projects that are substitutes for borrowing (delayed investment), the IRR rule has to be reverted. If IRR < r accept the investment, otherwise reject.
Exercise 2
Bob has invested 60% of his money in share A and the remainder in share B. He assesses their prospects as follows:
|
|
A |
B |
|
Expected return |
15% |
20% |
|
Standard deviation |
20% |
22% |
|
Correlation between returns |
0.5 |
|
a) What are the expected return and standard deviation of his portfolio?
Solution
• The expected return of the portfolio is

• The variance of the portfolio is
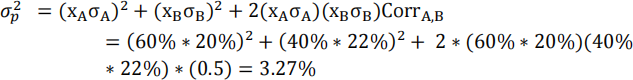
• This implies that the volatility of the portfolio is σp=18.1%
b) How would your answer change if the correlation coefficient was 0 or -0.5?
Solution
• Notice that the expected return does not depend on the correlation coefficient, while the volatility does
• Using the same formula as in point a) you get that
o When CorrA,B=0, then σp=14.9%
o When CorrA,B=-0.5, then σp=10.8%
• Explain that the correlation coefficient only affects the risk of portfolio, a lower correlation coefficient means less correlation between two assets, and a higher diversification of the portfolio risk.
c) Is Bob’s portfolio better or worse than one invested entirely in share A, or is it not possible to say?
Solution
• Explain that Bob’s portfolio is better, because it has a larger expected return and a lower standard deviation.
Exercise 3
Consider a world with the following two risky assets; a stock fund and a bond fund. Their expected returns and standard deviations are as follows:
|
|
Expected Return (%) |
Standard Deviation (%) |
|
Stock fund |
20 |
30 |
|
Bond fund |
12 |
15 |
The correlation between two assets is 0.10.
a) Find the Expected Return and Standard Deviation for the portfolios with the combination of the stock fund and bond fund at (25%, 75%), (50%, 50%), (75%, 25%) respectively.
Solution
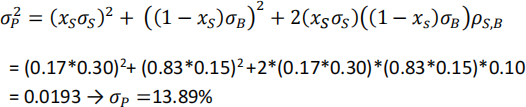
• For the portfolio weights (25%, 75%),
E[Rp]= xs *E[Rs] + xb * E[Rb] =0.25*20% + 0.75*12% = 0.14
![]()
![]() = (
= (![]()
![]()
![]()
![]() )2 + ((1 −
)2 + ((1 − ![]()
![]() )
)![]()
![]() )2 + 2(
)2 + 2(![]()
![]()
![]()
![]() )((1 −
)((1 − ![]()
![]() )
)![]()
![]() )
)![]()
![]() ,
,![]() = 0.0199
= 0.0199
![]()
![]()
![]() = 14.13%
= 14.13%
• For the portfolio weights (50%, 50%) E[Rp]= 0.50*20%+0.50*12%=0.16
![]()
![]() = 0.0303 →
= 0.0303 → ![]()
![]() =17.42%
=17.42%
• For the portfolio weights (75%, 25%) E[Rp]= 0.75*20%+0.25*12%=0.18
![]()
![]() = 0.0537 →
= 0.0537 → ![]()
![]() =23.17%
=23.17%
b) Find the portfolio with the two assets that has minimum variance and compute the expected return and standard deviation of the obtained portfolio.
Solution:
• The variance of the portfolio that invests xs in the stock fund and xb = 1- xs in the bond fund is
![]()
![]()

• To find ![]()
![]() that minimizes the portfolio variance, take the following first order condition
that minimizes the portfolio variance, take the following first order condition

• Solving for ![]()
![]()

• Hence xb = 1- xs = 1-0.17 = 0.83
• The expected return of this portfolio is
c) Describe the efficient set of the investment portfolios in graph, and explain why the portfolio is able to provide better expected return at same risk
level.
Solution:
• Draw a graph with the data from the following table
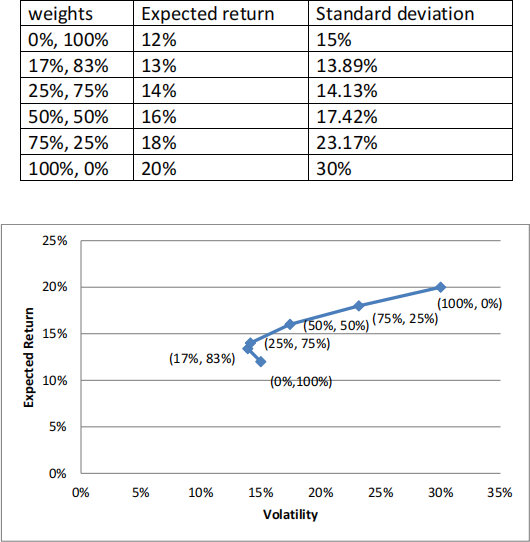
• Define what is an efficient portfolio
• Explain why the portfolio (0%, 100%) is inefficient
• Explain that any portfolio that invests more than 83% in the bond fund (or less than 17% in the stock fund) is inefficient
• The efficient set of portfolios includes all the portfolios that invest at most 83% in the bond fund (or at least 17% in the stock fund).
• Explain that the portfolio is able to provide better expected return at same risk level because of diversification, as the correlation of the returns of the two funds is lower than one.
d) Suppose risk free borrowing and lending is allowed, and the yield on T-bills is 8%, draw the capital market line to the efficient set, and explain your investment strategy given you are risk averse.
Solution
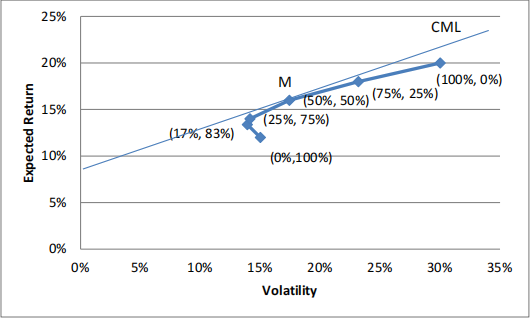
• Draw a tangent line from Rf =8%, and define the tangent point on efficient set (the one that maximizes the Sharpe ratio)
• Explain that when the tangent line goes through the market portfolio, it is called the capital market line (CML).
• Explain how portfolios on the CML are composed.
• In particular, the CML implies that if you are risk averse, you should choose any portfolio between Rf and M and explain what it means.
