关键词 > Python代写
INTRODUCTION TO DATA SCIENCE AND SYSTEMS
发布时间:2021-12-14
Hello, dear friend, you can consult us at any time if you have any questions, add WeChat: daixieit
DEGREE of MSc
INTRODUCTION TO DATA SCIENCE AND SYSTEMS (M)
1. Computational linear algebra and optimisation
You have been asked to help design the subcomponents of a music streaming service. The service has access to 101,750 music tracks (i.e. the audio files). Each music track can be
summarised based on the audio content using so-called audio features resulting in a 15 dimensional vector, x e R1x 15 , for each track. The meaning and importance of the individual
dimensions in the vector is unknown. The vectors for the individual tracks are collected in
a matrix X as row vectors.
Aside from the audio file itself, the service has access to the title and artist for each track, the genre(s) associated with each track (e.g. jazz) and finally the popularity of each track as a scalar y e R.
(a) The team wants to develop a function called ”What is this track called?” where users can
upload an audio file with the purpose to identify the name of the track and artist. To this end we are interested in computing Euclidian distances between the music tracks based on their vector representations.
(i) Certain aspects of X is summarised in Table 1. Explain why it is a good idea to normalise the data in X before computing the similarity between the tracks and suggest a suitable normalisation approach. Justify your approach and make reference to specific elements in Table 1. [3]
(ii) Design a simple search routine which can find the closest match between the uploaded
track and a track in the existing dataset. Write the procedure using equations or NumPy code (1-3 lines). Determine how many individual distances you will need to compute and discuss any potential scaleability issues. [3]
(b) A subcomponent of the system relies on a mapping from tracks to popularity. This can be formulated as a matrix problem: XwT - y = 0, where X is a matrix containing the music features for the tracks. w is a 15 dimensional vector and y is vector containing the popularity
scores for each track. The team is interested in the most efficient and robust method for
finding w using the squared error as the loss function.
(i) Specify the dimensions of the matrix X and determine if w and y are considered row or column vectors, respectively. [1]
(ii) Determine a method for solving the matrix equation wrt. w. Justify your approach. [2]
|
Dim. |
1 |
2 |
3 |
4 |
5 |
6 |
7 |
8 |
9 |
10 |
11 |
12 |
13 |
14 |
15 |
|
u |
0.1 |
-1.5 |
78.1 |
0.1 |
1.1 |
0.8 |
0.0 |
-159.3 |
0.2 |
0.0 |
0.0 |
0.1 |
0.0 |
-0.5 |
0.3 |
|
|
0.01 |
1.0 |
1.0 |
1.0 |
1.0 |
1.0 |
1.0 |
1.0 |
1.0 |
1.0 |
1.0 |
10.1 |
1.0 |
1.0 |
1.0 |
|
Min |
0.09 |
-4.0 |
75.1 |
-2.4 |
-1.9 |
-1.5 |
-2.9 |
-162.3 |
-3.7 |
-2.5 |
-2.4 |
-24.7 |
-2.6 |
-3.6 |
-2.6 |
|
Max |
0.12 |
1.6 |
80.5 |
3.0 |
3.8 |
3.2 |
2.3 |
-156.9 |
2.5 |
2.6 |
2.3 |
31.0 |
2.0 |
2.1 |
2.5 |
Table 1: Basic statistics for each dimension in X .
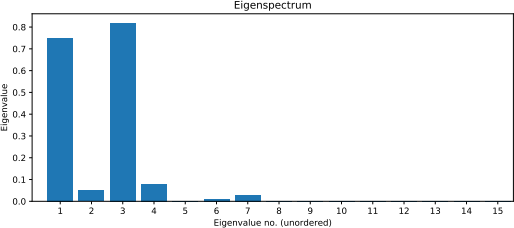
Figure 1: Eigenspectrum (unordered)
(c) The user interface team has requested that you provide a procedure for projecting the music tracks to 2D or 3D based on the vector representation so they can visualise the music tracks on a computer screen. You must use a linear map due to computational constraints.
(i) Outline a procedure for finding the 3D coordinates so the projection preserves most of the variance and can be implemented using only basic Python and NumPy by a junior data scientist. You should not provide the code, but explain the individual steps in the procedure using text or equations and only recommend the suitable NumPy commands. You must specify the dimension of the all vectors or matrices required to compute the projection. [4]
(ii) The eigenspectrum of the covariance matrix of X is shown in Figure 1. Discuss what the eigenspectrum says about the vectors representing the audio files and how this could be leveraged to make the system more efficient. Discuss if the team’s idea of a 2D or 3D interface is justified. [3]
(d) Your team is contemplating a new subcomponent which would enable users to generate a new music track. The team has already developed a function, r(x), which makes it possible to map from the vector representation, x, to the audio file.
The aim is to create a new track based on a genre profile which is a 5 dimensional vector, g e R5. Your team has provided a non-linear function, f : x 二 g, that maps from the track vector to the 5D genre profile. Provide a solution in the form of an optimisation problem and determine a suitable method to solve the stated problem. Justify your choice of method and explain under which circumstances it is guaranteed to converge to a sensible solution in this scenario. You will need to make assumptions which must be clearly stated. [4]
2. Probabilities & Bayes rule
Consider a scenario where you are in charge of analysing the data and modelling a pandemic. We consider a given disease (let’s call it ’VIRUS’), which has an unknown prevalence o in the population (we will assume that o e [0, 1] is the proportion of the population that has the disease). We will write the probability that a person is diseased as p(D) = o .
(a) Your lab has developed a fast testing procedure to detect this disease. In order to evaluate
the accuracy and reliability of this test, you have conducted trials on 132 subjects, and compared the results of your test with perfectly accurate (supposedly more expensive)
diagnostic. The results of those trials are collated in the following table:
positive negative
diseased healthy
28
12
3
89
(i) Using Bayes formula, and the trial data in the table, provide an estimate of the probab- ilities:
• p(D|T ), that a subject who tested positive is truly diseased; and
• p(D|![]() ), that a subject who tested negative is actually diseased. [4]
), that a subject who tested negative is actually diseased. [4]
(ii) Taking into consideration the test accuracy and reliability as evidenced in the trials, would this test be appropriate for the following situations:
1. regular testing of people working with vulnerable populations;
2. deciding on whether to administer a treatment with severe side effects; or
3. applying to the whole population to find all diseased individuals (justify your answers).
[3] (iii) You administer a test with probabilities p(D|T ) = 0 ·7 and p(D|![]() ) = 0 ·01 to a sample
) = 0 ·01 to a sample
of 1000 subjects drawn randomly from the population. The test returns 980 negatives and 20 positives.
From this data, calculate an estimate of the prevalence p(D) explaining your reasoning.
[4]
(b) Let us consider that you are experimenting with a vaccine against the disease. You have
1000 subjects in group A who take the vaccine and 1000 in group B who take a placebo. Let us assume that you test the subjects in both groups daily, and after one month you obtain the following results: 2 subjects from group A tested positive at some point during the month, and 40 subjects from group B. In this part we will assume that we are using a test with the following statistics:
• the probability of having the disease if tested positive is p(D|T ) = 0 ·7
• the probability of having the disease if tested negative is p(D|![]() ) = 0 ·01.
) = 0 ·01.
(i) Accounting for the limitations of the test, how many subjects in group A and B did possibly catch the disease during this month? [5]
(ii) The efficacy of a vaccine is typically calculated as
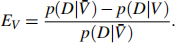
Use your results from above to calculate the efficacy of the vaccine. Discuss what would happen if your test were less accurate: What would happen if p(D|T ) would be lower? If p(D|![]() ) would be higher? [4]
) would be higher? [4]
3. Database systems
Consider a relation Student(ID, Name, StudyPlan) – abbreviated as S – where the primary key (ID) is a 64-bit integer, the Name attribute is a 40-byte (fixed length) string, and Study- Plan is a 16-bit integer. Further consider a relation Marks(ID, CourseID, AssessmentID, Mark) – abbreviated as M – with ID being a foreign key to Student’s ID, CourseID and AssessmentID being 16-bit integers, Mark being a 64-bit float, and the first three attributes making up the relation’s (composite) primary key.
Assume that both relations are stored in files on disk organised in 512-byte blocks, with each block having a 10-byte header. Assume that S has rS = 1, 000 tuples and that M has rM = 100, 000 tuples. Last, assume that Student is stored organised in a heap file, and Marks is stored organised in a sequential file sorted by its primary key. Note that the database system adopts fixed-length records – i.e., each file record corresponds to one tuple of the relation and vice versa.
(a) Compute the blocking factors and the number of blocks required to store these relations.
Show your work.
[2]
(b) Consider the following query:
SELECT S.Name, M.ID, M.Mark FROM Student as S, Marks as M WHERE S.ID = M.ID AND S.ID >= 10,000 and S.ID <= 10,199;
Assume that the memory of the database system can accommodate nB = 22 blocks for processing, that all student IDs in the query range exist in the database, and that all students have the same number of marks on average.
Consider the following two approaches: (a) S is scanned at the outer loop (9 marks total) and (b) M is scanned at the outer loop (9 marks total). For each approach, explain the query processing algorithm (3 marks for each approach) taking care to include the file organisation in your reasoning, and estimate the total expected cost (in number of block accesses) for these two strategies (6 marks for each approach). Disregard the cost associated with the writing of the result set. Show your work.
[18]
