关键词 > CM2005
CM2005 Object Oriented Programming Midterm assignment
发布时间:2024-06-21
Hello, dear friend, you can consult us at any time if you have any questions, add WeChat: daixieit
BSc Computer Science
CM2005 Object Oriented Programming
Midterm assignment
Introduction
The goal for this assignment is to develop a technical analysis toolkit for visualising and predicting weather data using a command line interface. The dataset is provided as a zip file with the assessment brief or can be downloaded from https://data.open-power-system- data.org/weather_data/2020-09-16.
TASK 1: Compute candlestick data
To complete this task, you need to be able to compute candlestick data from the temperature data for a particular location in Europe between 1980-2019. Here is an example of the fields needed for candlestick data:
|
Date |
Open |
High |
Low |
Close |
|
1980-01-01 |
-1.249 |
20 |
-3 |
-1.200 |
|
1981-01-01 |
-1.200 |
25 |
-2 |
-1.300 |
|
1982-01-01 |
-1.300 |
27 |
-1 |
-1.400 |
|
1983-01-01 |
-1.400 |
28 |
-1 |
-1.350 |
|
1984-01-01 |
-1.350 |
24 |
0 |
-1.450 |
Please note the dataset contains temperature data collected at an hourly rate for each European country (columns with two-character prefixes, i.e., GB, FR, ES, etc.). However, the example table above might be the candlestick data for the ‘yearly temperature of GB’ . To compute those fields:
• Open: the average mean temperature per time frame (i.e., year) in the previous time frame.
• Close: the average mean temperature per unit in this time frame (same as Open, but for the current time frame).
• High: highest temperature value seen this time frame.
• Low: lowest temperature value seen this time frame.
You should implement the candlestick data computation using a function which returns the following data type:
std::vector<Candlestick>
Note that it returns a vector of Candlestick objects. You will need to define your own Candlestick class that is suitable for representing candlestick data.
TASK 2: Create a text-based plot of the candlestick data
The second task involves creating a text-based plot of the candlestick data (i.e., daily, monthly or yearly). Figure 1 shows an example of a graphical plot. You should try to create something like that using text output. We recommend that you approach this by first typing out what kind of characters you might use in your plot to represent different things. Use your text editor to do this. E.g. you might use a ‘-’ to represent the top of a box and a ‘|’ to represent the stalk.
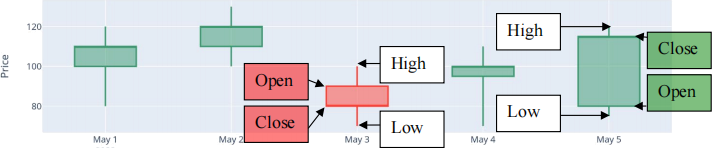
Figure 1: Shows an example of a graphical candlestick plot for stock trading data but can be represented for temperature data too. Each box represents the trading activity in a time period. The top and bottom of a box represent the opening and closing value of a price. The top and bottom of the lines represent the highest and lowest values seen in that time frame. The red box on May 3rd indicates the value was lower at close than open, so the value went down. You do not need to make a graphical plot – you should make a text-based plot for temperature data.
TASK 3: Filter Data and Plotting using text
Task 3 involves providing at least two filter data options (i.e., by date range, country, and temperature data range) and plotting a text-based graph. Again, you need to plot it using text characters, and you should probably start by manually creating the text graph in your text editor, so you know what you are aiming for.
TASK 4: Predicting Data and Plotting
Task 4 involves predicting temperature changes between the date range of your choice and a country. You should support your statements by developing appropriate prediction functions of your choice that calculate these values from the historical data provided.
Provide a brief description of the prediction function used with a justification. Include a fragment of code with a description of the calculation method with implementation logic adapted and the prediction results.
What to submit
A PDF file containing all code. You can concatenate all .cpp and .h files into a single text file and then save them as a PDF.
A PDF file containing your report, wherein you should describe how you carried out each task with a supporting screenshot and description of the final output.
A maximum of 3-minute system demonstration video with voice narrative showing key features developed and code logic behind it.
Marking criteria Item
Item
Code style: indentation, descriptive comments 6
TASK 1: Compute candlestick data CODE* 10
TASK 1: Compute candlestick data DESCRIPTION 6
TASK 2: Create a text-based plot of the candlestick data CODE* 10
TASK 2: Create a text-based plot of the candlestick data DESCRIPTION 6
TASK 3: Filtering option and plot a text graph CODE* 10
TASK 3: Filtering option and plot a text graph DESCRIPTION 6
TASK 4: Predicting data and plotting with a chosen model with CODE* 10
TASK 4: Predicting data and plotting with a chosen model justification and DESCRIPTION 6
Originality and challenge of implementation 10
Clearly label all sections of the code that you personally wrote without assistance * 6
Submit correct items: code as text in PDF, report as PDF, a ZIP file for the code & a video+. 4
Video demonstration with voice narration of features implemented and code execution. 10
TOTAL 100
* Please note: your CODE implementation will be marked based on your evidence provided in the CODE PDF file where you clearly indicate where the code is located for ALL TASKS that you have personally written without assistance. Remember to submit a REPORT as a PDF file providing details of how all the tasks are implemented, what logic/methods were adopted and why. Also, screenshots of the results/output with reference to code fragments (i.e., copy/ paste code in the report or provide page numbers where relevant to the CODE PDF file).
+ If you do NOT submit CODE PDF AND REPORT PDF files along with the program files in a ZIP file, NO MARKS will be awarded for the respective tasks for the CODE implementation marking criteria.
