关键词 > FE5214
FE5214 Assignment 2
发布时间:2024-06-20
Hello, dear friend, you can consult us at any time if you have any questions, add WeChat: daixieit
FE5214 Assignment 2, Due: Monday, 18 March 2024
Submit your answers to Canvas. Word and PDF files are acceptable. Please include your name (family name first) at the beginning of the filename.
In this assignment, you will construct an alpha factor based on the prior 5-day returns and evaluate the effectiveness of the factor.
1. Consider the US market and the years 2006 to 2023 (you will also need some data in 2005 to calculate the alpha factor). The universe used will be based on the universe from the start of the year (defined in the univ_h.csv file).
2. To construct the factor,
a) calculate the volatility σi (t) using the prior 21 days of daily returns (use the log return ri(t') = In  , t' = t − 20, … , t , the return is set to 0 if there is an “NA” in the adjusted prices). If σi (t) obtained is less than 0.005, set it to 0.005
b) calculate the prior 5-day return; you can use the log return vi(t) = In  (again, the return is set to 0 if the prices are not available)
c) normalize the variable by dividing the volatility σi (t) obtained in step a), vi (t) ← vi (t)/σi (t)
d) subtract out the industry component, vi (t) ← vi (t) − vI (t) , where vI (t) is the average of vi (t) (after step c) overall stocks in the industry that the stock i belongs to.
3. Do a cross-sectional regression
Ri (t + 1) = β(t)vi (t) + Ei (t), i = 1, … , N
on everyday t (except for the last day of the available data) and get a time series of β(t) and a time series of R2 (t) . Here the industry return is removed from ri (t + 1): Ri (t + 1) = ri (t + 1) − rI (t + 1)
For this simple one-variable regression, you can calculate β(t) and R2 (t) directly:
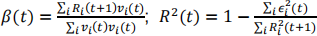
4. For the years 2006 to 2023, calculate and list the average of β(t) for each year and the corresponding t-stat, √T ×(the average of β(t))/(the standard deviation of β(t)), where T is the number of β values obtained for the year. Comment on your results.
5. For the years 2006 to 2023, calculate and list the average R2 (t) for each year. Comment on your results.
6. Repeat the calculation (Steps 3-5) using a ranked variable, by adding a sub-step in the construction of the factor:
rank the normalized variable after step 2c) from the largest (rank 1) to the smallest (rank N) and redefine the factor in terms of the rank, k,
v = (N+1-2k)/(N-1),
N is the number of stocks in the universe on the day Then proceed to step 2d)
Describe the main steps of your calculation process to obtain the results.
