关键词 > MATH2010
MATH2010 Statistical Modelling I SEMESTER 1 EXAMINATION 2020/21
发布时间:2024-06-17
Hello, dear friend, you can consult us at any time if you have any questions, add WeChat: daixieit
MATH2010 Statistical Modelling I
SEMESTER 1 EXAMINATION 2020/21
1. [25 marks] Power laws are common to describe natural phenonomen in areas such as physics, biology and economics. A simple power law for a response variable Y and explanatory variable x is given by Y = xβ . Assuming Y is actually observed with some error, the linear model
logYi = β log xi + εi (1)
could be used to estimate β from data (yi , xi ), i = 1, . . . , n, where εi ~ N(0, σ2 ) and εi , εj are assumed independent for all i ≠ j.
(a) [7 marks] Show that the least squares estimator of β has the form
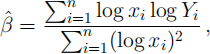
and derive its expected value and variance. (b) [8 marks] An alternative estimator is given by
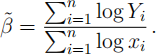
Derive the mean and variance of β, and hence show that β is unbiased but has
variance at least as large as the variance of β(^) .
(c) [10 marks] The below data set gives the period (yi; seconds) of an oscilating object at the end of a spring for five objects of different masses (xi; kg).
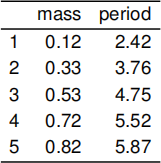
You may find the following quantities from R useful:
2. [25 marks] Consider the usual multiple linear regression model Y = Xβ + ε ,
with Y an n × 1 response vector, X an n × (k + 1) design matrix, β a k + 1 vector of unknown parameters and ε ~ N (0, σ2In ). Assume least squares will be used to estimate β .
(a) [4 marks] Write down expressions for the vector of fitted valuesY(^) and the vector
of residuals R in terms of Y and the hat matrix H.
(b) [6 marks] Find the expectation and variance-covariance matrix for each ofY(^) and R.
(c) [8 marks] Show that the cross-covariance matrix cov(Y(^) , R) is a matrix with
every entry zero. Explain the importance of this result for model checking via residual plots.
(d) [2 marks] Residual plots are commonly used to check linear model assumptions. Which model assumptions are checked by
(i) a plot of residuals against fitted values? (ii) a normal probability plot of residuals?
(e) [5 marks] Sketch examples of how the residual plots above would give evidence that
(i) the model assumptions are adequate.
(ii) the error distribution has rightskew.
(iii) the variance of error term increases as a function of the mean of Yi.
3. [25 marks] A study on the taste of cheddar cheese recorded a subjective taste score (taste) and the concentrations of acetic acid (Acetic),lactic acid (Lactic) and hydrogen sulfice (H2S) on 30 samples. A multiple linear model was fitted that regressed taste on the three explanatory variables (with H2S logged before being included). Partial results from fitting the model are given below, and some quantities from R are given on the next page.
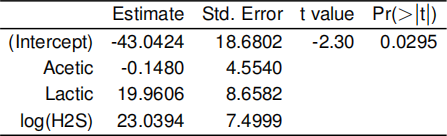
(a) [2 marks] Write down the fitted regression model.
(b) [2 marks] How many degrees of freedom are left to estimate the residual standard error?
(c) [4 marks] Conduct a test to determine if logH2S is a significant explanatory variable at the 5% level.
(d) [4 marks] Construct a 99% confidence interval for β2 , the coefficient of Lactic in the regression model.
(e) [3 marks] Test the null hypothesis H0 : β2 = 5 against the alternative H1 : β2 ![]() 5 at the 1% level of significance.
5 at the 1% level of significance.
(f) [10 marks] Consider the partial output from running the anova command in R using these data.
Using this information, compare the null and full regression models using an
F-test. What is the value for your test statistic, and which model do you prefer?
You may find the following quantities from R useful:
4. [25 marks] Data were collected from n = 21 consecutive days at a plant for the
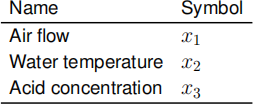
oxidation of ammonia to nitric acid. The response is 10 times the percentage of the ingoing ammonia to the plant that escapes from the absorption column unabsorbed; that is, an (inverse) measure of the over-all efficiency of the plant. There are m = 3 explanatory variables as given in the table below.
A series of eight linear regression models, labelled A, B, . . . , H, are fitted. The table below shows the residual sum of squares (RSS, to 3 decimal places) of each of these models where the x or - in the columns headed x1 , x2 and x3 indicates whether the model includes (x) or excludes (-) the corresponding explanatory variable.
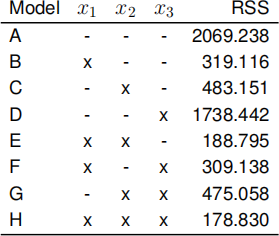
(a) [1 mark] For each model (A, B, . . . H), write down the value of k, the number of explanatory variables.
(b) [1 mark] Explain why the residual sum of squares (RSS) cannot be used for modelselection.
(c) [7 marks] For each model (A, B, . . . H), calculate the adjusted R2 . Other than the null model, which model has the smallest value of this quantity?
(d) [2 marks] How do AIC and BIC overcome the issues inherent with using the RSS to perform model selection? If the models selected using AIC and BIC differ,
which would include more explanatory variables?
(e) [6 marks] For each model (A, B, . . . H), calculate the value of AIC and BIC using the definitions given in lectures. Determine the final chosen model under each of AIC and BIC. Comment on any differences between the models selected using
AIC, BIC and adjusted R2 .
(f) [4 marks] For each of forwards and backwards selection with BIC:
(i) For which models would you not need to calculate BIC?
(ii) Which is the final model chosen?
(g) [4 marks] How many possible two-way interactions are there between the
explanatory variables in this study? How many models can be constructed
including two-way interactions, both with and without imposing effect heredity?
Learning objectives:
LO1 Use the theory of linear models and matrix algebra to investigate standard and non- standard problems.
LO2 Interpret the output from an analysis including the meaning of interactions and terms based on qualitative factors.
LO3 Understand how to make a critical appraisal of a fitted model.
LO4 Carry out t-tests and calculate confidence intervals by hand and by computer. LO5 Using a variety of procedures for variable selection.
LO6 Fit multiple regression models using the adopted software package.
LO7 Carry out simple linear regression by computer.
LO6 and LO7 are assessed via coursework.
