关键词 > MSINM014/MSING014/MSING014B
MSINM014/MSING014/MSING014B DECISION & RISK ANALYSIS ─ 2016/17 FINAL EXAM
发布时间:2024-06-13
Hello, dear friend, you can consult us at any time if you have any questions, add WeChat: daixieit
MSINM014/MSING014/MSING014B
DECISION & RISK ANALYSIS ─ 2016/17
FINAL EXAM
Part I: Optimization
The Dimes Company purchases apples from local growers and makes applesauce and apple juice. It costs $0.80 to produce a jar of applesauce and $0.60 to produce a bottle of apple juice. The company has a policy that at least 20 percent but not more than 60 percent of its output must be applesauce (in terms of the number of jars and bottles).
The company wants to meet but not exceed the demand for each product. The marketing manager estimates that the demand for applesauce is a maximum of 5,000 jars, plus an additional 3 jars for each $1 spent on advertising for applesauce. The maximum demand for apple juice is estimated to be 4,000 bottles, plus an additional 5 bottles for every $1 spent on advertising for apple juice. The company has $16,000 to spend on producing and advertising its two products. Applesauce sells for $1.75 per jar; apple juice sells for $1.75 per bottle. The company wants to know how many units of each product to produce, and how much advertising to spend on each product, in order to maximize profit.
In order to determine how to spend their money on each product and advertising their business, an analyst came up with a model with the following decision variables.
• S: Number of jars of applesauce produced
• AS: Amount ($) spent on advertising for applesauce
• J: Number of bottles of apple juice produced
• AJ: Amount ($) spent on advertising for apple juice
Question 1. Model
Suppose that you are the business analyst for the company and want to determine how to allocate the available budget on producing and advertising each product so that Dime’s profit is maximized. Clearly write down the objective function and constraints using the decision variables defined above (S, AS, J and AJ).
Suppose that you have completed the model and find the optimal solution using Excel solver. Below, you will see the excel file with the solution, the excel file with the formulas and the sensitivity analysis report.
Figure 1: Excel file
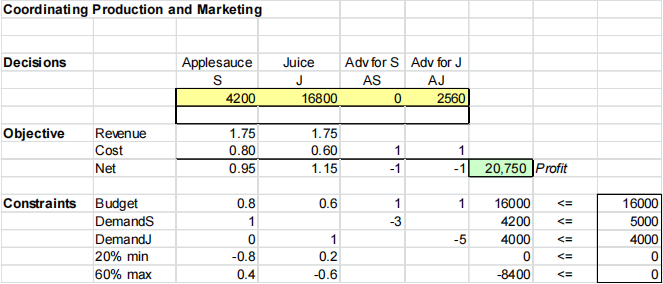
Figure 3: Excel solver table inputs
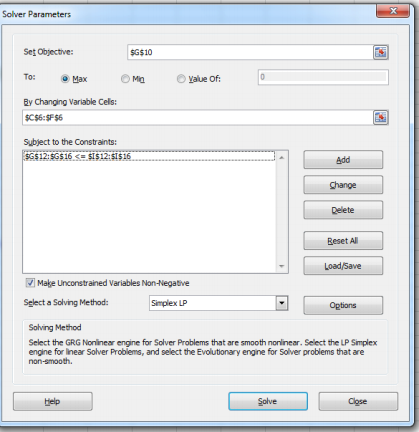
Table 1. Sensitivity Analysis Report
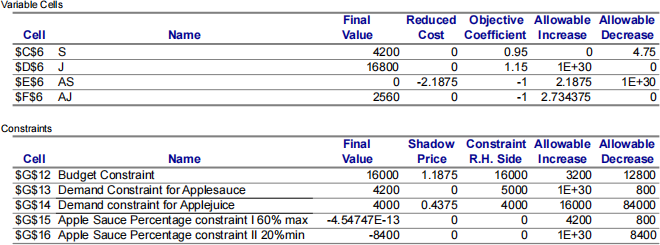
Question 2. Sensitivity Analysis
If Dimes Products Company had an additional $2000 available, how much more money could they make by investing it in their apple business?
Question 3. Reformulation of Optimization Problem
Dimes is thinking of running aTV ad campaign that can boost the demand of both applesauce and apple juice. A marketing consulting firm has informed them that every $1 spend on a TV ad will increase the demand for applesauce by 2 bottles and apple juice by 3 bottles. Formulate the decision problem for Dimes with the availability of the TV ads.
Part II: Decision Analysis
A customer has approached XYZ bank for a $50,000 one-year loan at 12% interest. If the bank does not approve the loan, the $50,000 will be invested in bonds that earn a 4% annual return. Without further information XYZ feels that there is a 6% chance that the customer will totally default on the loan. If the customer totally defaults, the bank loses $50,000.
Question 4. Decision Tree and Optimal Strategy
Assuming XYZ bank is risk neutral, what should they do? What would be bank’s expected profit? Explain the meaning of this expected profit.
Question 5. Risk Profiles
Create the risk profiles of the decisions involved and comment on how you would use this information to decide whether or not to go ahead with the loan.
Question 6. Sensitivity Analysis
As mentioned before, historical information shows that, on average, 6% of the customers default on their loan. However, a closer look reveals that there is some uncertainty and this number is between 5% and 9%. How does this affect your analysis and recommendation? (Hint: Find expected profit of the bank from approving and not approving the loan when the default probability is 5%, 6%, 7%, 8% and 9% and compare them for each of these values to find the optimal strategy.)
Question 7. Value of Information
The XYZ bank is considering hiring a credit history check agency, which would be able to predict whether or not a particular customer is likely to default on a loan or not. Suppose the agency would be able to predict defaults with perfect accuracy. What is the maximum that the bank should be willing to pay in order to obtain this information, i.e. to know for sure whether or not the customer will default before approving or rejecting the loan?
Part III: Simulation
The MBA is the flagship program of the AB Business School. Not only is the program training the future business leaders, but it is also generating important operating profits that fund other activities of the school, such as research.
The MBA programme has seen a tremendous increase on the number of applications year-on-year, and given the consistently high performance in rankings, the MBA office expects this trend to continue next year. In line with its mission to improve practice through education, the School is considering to expand its admissions for the program for this year from 2 streams (75 students in each stream) to 3 streams and next year they will again reconsider the number of streams. This is an expensive proposal and before committing to it, Steve, a newly appointed manager at the MBA office, was asked to analyse the financial viability of such an expansion. Steve came up with the following numbers.
Cost and revenue
The fixed costs associated with the MBA programme are about £2M per year (no matter how many streams the School will run) plus another £1M per stream, while the net revenue amounts to £30,000 per student. There is uncertainty though for these values. Specifically, the fixed cost is likely to be anywhere between £1.7M and £2.3M with the same probability, the cost per stream between £0.8M and £1.2M with the same probability and the net revenue from each MBA student will be £30,000 in 1 out of 2, £25,000 in 1 out of 4 cases, and £33,000 in 1 out of 4 cases.
Applications
The School received 2,000 applications last year, representing a 5% increase from previous years, and it is expecting next year to receive about 2100 applications. The quality of these applications varies widely, but it is expected that 345 applicants (approximately 16.4% of the total) exhibit the academic and leadership qualities necessary to be given an offer. From the candidates given an offer, historically, 53% enrol to the program. Needless to say, there is substantial uncertainty on all these figures. Based on past experience, the number of high quality applications is most likely to be 345 but it could be as low as 230 and or as much as 470. The percentage of offers that enrol is also uncertain and takes values between 50% and 56% with 53% being the most likely. If the number of potential students is higher than the capacity of the Programme then the School will create a waiting list for the additional potential students.
Steve summarized this information in Table 2.
Based on this analysis, and given the prestige of expanding the program, the MBA office concluded that it is probably a good idea to not proceed with the third stream because it will generate a lower profit.
Table 2: Profitability of the MBA Programme
|
|
2 Streams |
3 Streams |
|
Revenue per student |
£30,000.00 |
£30,000.00 |
|
Fixed cost |
£2,000,000.00 |
£2,000,000.00 |
|
Cost per stream |
£1,000,000.00 |
£1,000,000.00 |
|
High quality applications |
345 |
345 |
|
Accepted applicants enrolled |
53% |
53% |
|
Potential Students |
183 |
183 |
|
Places per stream |
75 |
75 |
|
Number of streams |
2 |
3 |
|
Capacity |
150 |
225 |
|
Number of students enrolled |
150 |
183 |
|
Revenue |
£4,500,000.00 |
£5,490,000.00 |
|
Cost |
£4,000,000.00 |
£5,000,000.00 |
|
Profit |
£500,000.00 |
£490,000.00 |
Question 8
Steve decided that in order to make a more informed decision he needed to do a
simulation with 1,000 iterations. Can you give him advice on what distributions to use for the uncertain inputs?
After performing the simulation Steve plotted the graphs below.
Figure 4: Simulation Output for two streams
![]()

Figure 5: Simulation Output for three streams

Figure 6: Comparison of the two options
profit / 2 streams
![]() -0.60
-0.60
|
|
|
|
||||||
|
17.0% |
|
22.5% |
||||||
|
|
|
|
|
|
|
|
|
|
|
|
|
|
|
|
|
|
|
|
|
|
|
|
|
|
|
|
|
|
|
|
|
|
|
|
|
|
|
|
|
|
|
|
|
|
|
|
|
|
![]() -- profit / 2 streams
-- profit / 2 streams
|
Minimum Maximum Mean std Dev values |
-E958,912.45 E1,713,387.28 E424,988.44 E559,337.39 1000 |
![]()
profit / 3 streams
Minimum -E2,740,554.81 Maximum E3,671,499.21 Mean E448,982.37 std Dev E1,087,484.26 values 1000
values in Millions (E)
Question 9
What is the average and realistic downside and upside of each of the two cases (i.e., 2 streams
|
and 3 streams)? |
Questions 10
Steve was informed by the School board that the School cannot afford losing more than 1M from the MBA Programme (losing such an amount will jeopardize the existence of the School). Should Steve recommend to the MBA office to choose 2 or 3 streams? Please make an explicit recommendation (based on this analysis) and justify your criterion.
