关键词 > ECON2J03
ECON 2J03 - Spring 2024 Assignment 2
发布时间:2024-06-08
Hello, dear friend, you can consult us at any time if you have any questions, add WeChat: daixieit
Assignment 2
ECON 2J03 - Spring 2024
Due: June 10, 2024, Monday at 11:59 PM
Requirement and instruction:
A. You have the option to complete the assignment individually or as a group (Max 7 members). If you choose to work in a group, please ensure that each group member's full name and student
ID number are clearly printed on the first page of the assignment. Only one copy of the assignment per group should be submitted.
B. For the group assignments, the assignment file title should be
LastName_FirstName_GroupAssignment and the first name and lastname should be for the
person submitting the file. For the individual assignments, the file title should be LastName_FirstName_IndividualAssignment.
C. The assignment must be submitted in .doc, .jpeg or .pdf format. No other format will be accepted for grading.
D. You may type your answers or write them using pen/pencil and submit the scanned image of your answers.
E. You should submit your assignment in the drop box of the assignments on A2L.
Questions (total: 12 marks)
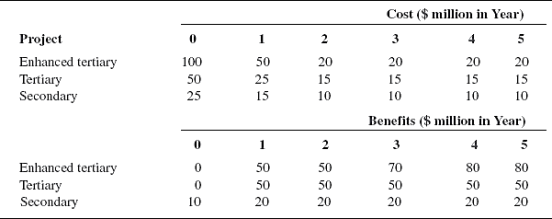
1. (2.5 marks)
Using the numbers from Table below for the three different options to upgrade municipal sewage treatment to illustrate the impact of choosing different interest rates to discount the net benefits, compute the present value of each project if the interest rate is 2.5 percent, then 10 percent, and finally, 20 percent.
2. (2 marks)
The federal government introduces new pollution regulations that reduce the pollution threatening lobster stocks on the East Coast. Let MC = 5Q represent the costs of harvest for a lobster harvester before the policy. The regulation reduces harvesting costs by 50 percent. What are the net benefits to the lobster harvester from the regulation? How would you show this on an MD curve?
3. (2 marks)
Suppose Industry A faces an inverse demand curve given by: P=90-1.5Q. Let the supply curve of the industry be: MC=0.5Q. The government impose a pollution-control law that causes production costs to rise to MC=10+0.5Q. Compute the loss of producer and consumer surplus from the regulation and illustrate the change in consumer and producer surplus on a graph.
4. (1 mark)
An environmental regulation results in the closing down of many firms in an industry, leaving just two or three dominant firms. How might this affect the long-run costs of the regulation?
5. (1 mark)
Prove graphically that a technological change that lowers marginal abatement costs (MAC) can lead to higher levels of environmental quality.
6. (2 marks)
Solve for the two socially efficient equilibria for the two MD functions in the figure below. Suppose the regulatory authority imposes a uniform standard at the emission level mid-way between the two socially efficient emission levels. What are the excess damages from under- control in the urban area and over-control of damages in the rural area?

7. (1.5 marks)
Suppose the MD function in the example of the chemical factory and fishery is MD = 8E.
Compute the socially efficient equilibrium and determine whether assigning to the factory or fishery the property rights to the river maximizes the sum of net gains after the parties bargain the socially efficient solution. Explain intuitively why this is different from the example in chapter 10 when MD = 6E.
