关键词 > STATGU4206/GS5206
STAT GU4206/GS5206 Sample Midterm
发布时间:2021-11-26
Hello, dear friend, you can consult us at any time if you have any questions, add WeChat: daixieit
STAT GU4206/GS5206 Sample Midterm
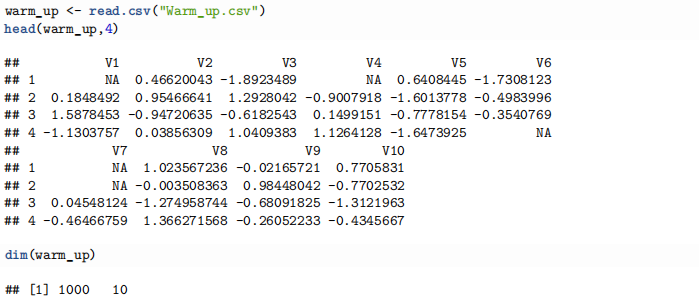
Part I: Warm-up
Run the following code:
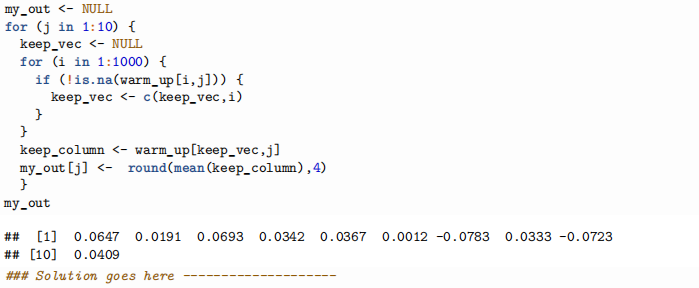
Question 1: (10 pts)
Perform the same task as the following chunk without using a loop and in one line of code.
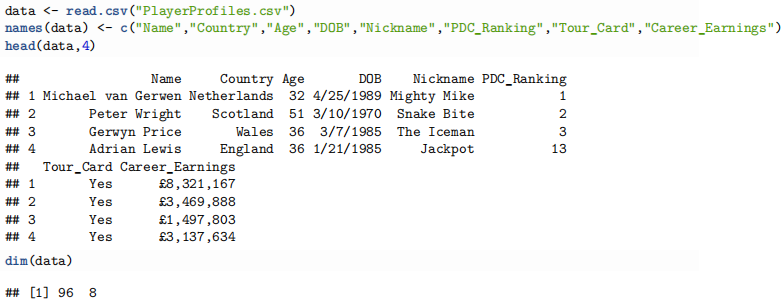
Part II: Data Cleaning and Graphics
Run the following code:
Question 2: (5 pts)
There appears to be some repeated cases in the dataframe (data). Identify the number of repeated cases in this dataset. There are many ways to solve this problem, e.g., you can look at repeated names or nicknames and then figure out how to extract this information from the dataframe. I personally used a loop for this problem.

Question 3: (5 pts)
Create a new dataframe called new_data that excludes all repeats. For partial credit, you can manually identify the repeats and remove these cases with a basic subsetting command. Display the head and dimension of new_data. I personally used a loop for this problem.
Question 4: (10 pts)
Use base R character string functions to convert the Career_Earnings variable into a numeric mode. For example, the symbol £535,131 should be converted to 535132. Your converted variable should be appended to your dataframe and named Career_Earnings_NUM. You can use the original data or new_data to solve this problem. Display the head of the numeric vector Career_Earnings_NUM.
Question 5: (10 pts)
Using relevant R functions, identify the 5 most frequent countries measured in this dataset. Display the country and its frequency. Note that England should have the highest frequency. You can use the original data or new_data to solve this problem. Also create a barplot displaying the 5 most frequent countries.
Question 6: (5 pts)
Create a new variable in the dataframe named England, which reads “England” if the case belongs to England and “NotEngland” otherwise. You can use the original data or new_data to solve this problem. Display the head of the England variable.
Question 7: (5 pts)
Using Base R, construct a scatter plot of log(Career_Earnings_NUM) versus PDC_Ranking, split by England. Make sure to include a legend and label your axes appropriately.
If you could not solve question 4, construct a base R scatter plot of PDC_Ranking versus Age, split by England. Make sure to include a legend and label your axes appropriately.
Question 8: (5 pts)
Using ggplot, construct a scatter plot of log(Career_Earnings_NUM) versus PDC_Ranking, split by England. Make sure to include a legend and label your axes appropriately.
If you could not solve question 4, construct a ggplot scatter plot of PDC_Ranking versus Age, split by England. Make sure to include a legend and label your axes appropriately.
Part II: Nonparametric Procedures
Question 9: (10 pts)
Compute the the two conditional probabilities (or proportions):
I) Given the respondent represents England, what is the probability that their PDC_Ranking is in the upper 25%?

II) Given the respondent does not represent England, what is the probability that their PDC_Ranking is in the upper 25%?

Question 10: (20 pts)
Consider testing the the null alternative pair:

Run a bootstrap procedure to test the above hypothesis. To accomplish this task, construct a 95% bootstrap interval on the parameter  and check if 0 falls in the interval.
Note for comparison, you can look up the two-sample proportions z-test, which is the analogous parametric procedure. The final results should be similar. Also note that the bootstrap hypothesis test introduced above is two-tailed, which only shows that the proportions are statistically different. A one tailed test might be more appropriate but this approach is not required for the midterm.
Part III: Writing a R function
Question 11: (10 pts)
Write a function named my_description that creates a written description of a particular dart player. The function should have two inputs, (1) the case as an integer and (2) the data frame (new_data or data). For example, respondent 3 is Gerwyn Price, i.e., my_description(case=3,df=new_data). Your function’s output should read similar to:
“Gerwyn Price aka The Iceman, is a 36 year old dart player from Whales. The Iceman is currently ranked number 3 and his career earnings total 1497803 dollars.”
Try to make this exercise fun. You can write the above expression however you want but your function must generalize to multiple cases. You can also include extra information if desired. To check your function, make sure to display your function’s output for Gerwyn Price.
Question 12: (5 pts)
Use a vectorized operation or an apply function to compute all dart player’s descriptions. Show the head of your resulting vector.
