关键词 > CIVL2700/9700
CIVL2700/9700 TRANSPORT SYSTEMS ASSIGNMENT 2
发布时间:2024-05-31
Hello, dear friend, you can consult us at any time if you have any questions, add WeChat: daixieit
CIVL2700/9700 TRANSPORT SYSTEMS
ASSIGNMENT 2
Due: 29 April 2024
Problem 1 (20%)
Suppose that Alice’s utility depends on how many hours she works W, on his expenditure on general goods G, on the number of movies she watches on the cinema M, and on her transport mode. Consider that:
• She must allocate B hours every day to basic needs.
• She must work at least H hours, which gives her an income of I. Every extra hour is paid at a rate of E.
• Every movie she watches costs q and lasts v. (For the sake of simplicity, you can consider that the number of movies can take fractional values).
• She can choose between biking, which is free, takes a time b, and gives her a utility of u, or driving her car, which costs c, takes a time a and gives her zero utility.
Write the optimisation problem solved by Alice.
Problem 2 (20%)
Consider n vehicles that are continuously driving in a circuit of length L. Each vehicle has a constant velocity, which we denote v1, … , vn , respectively. There is a sensor measuring the number and speed of vehicles that cross a given threshold. Assume that since the beginning of the measuring, there is a time T where all vehicles have just crossed the line. Using the data collected by the sensor, determine the TMS and SMS.
Problem 3 (20%)
Assume a car park facility where the arrival rate is λ customer every minute, and the service process including pressing the button, taking the card, and waiting for the boom to rise leads to service rate of μ customer every minute.
a. Assume the arrival and service processes are stochastic. Using any software (Excel, Matlab, or the one you prefer), plot average delay time (including service time) and average queue size (including the vehicle currently being served) for all combinations of λ = {1,2,3, . . ,10} and p = {0.1,0.3,0.5,0.7,0.9}. Specifically, we ask you to make 2 graphs (one for average delay and the other for average queue size), where the x-axes contains the different values for λ, and where you make one curve for each p.
b. Assume the arrival process is stochastic but the service process is deterministic with rate μ . Using any software (Excel, Matlab, or the one you prefer), plot average delay time (including service time) and average queue size (including the vehicle currently being served) for all combinations of λ = {1,2,3, . . ,10} and p = {0.1,0.3,0.5,0.7,0.9} and compare graphically with plots from part (a). State observations from the comparison.
Problem 4 (20%)
Draw the following Input-Output curves for a 2-hour window to scale. Identify graphically in the curves the maximum queue length, the maximum delay faced by a customer, and the clearance time.
i) Vehicles arrive at a constant rate of 12veh/hand are serviced at a rate of 10veh/h for 1 hour. In the second hour, vehicles arrive at a constant rate of 15 veh/hand are serviced at a rate of 20veh/h.
ii) Vehicles arrive at a decreasing rate, with λ(t) = 1.2 − 0.01t (t is measured in minutes), and the service rate is increasing, with μ(t) = 1 + 0.01t.
Problem 5 (20%)
In a segment of a highway, a total flow of 1500 veh/h is observed. All the vehicles are homogeneous and travel at 44.4km/h. You know that traffic can be modelled by:
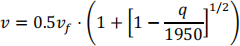
For q ≤ 1950, where v represents speed, vf free-flow speed, and q flow. Determine the value of vf , the jam density, and the maximum capacity of the highway.
