关键词 > Python代写
Studying glaciers
发布时间:2021-11-24
Hello, dear friend, you can consult us at any time if you have any questions, add WeChat: daixieit
Studying glaciers
Reading and analysing historical datasets
Please read this assignment carefully.
This assignment asks you to write some code for loading and analysing a real dataset about glaciers around the world. We will describe how the code must behave, but it is up to you to fill in the implementation. Besides this, you will also need to create some tests, and demonstrate your ability to use git version control and GitHub.
The exercise will be semi-automatically marked, so it is very important that your solution adheres to the correct file and folder name convention and structure, as defined in the rubric below. An otherwise valid solution that doesn’t work with our marking tool will not be given credit.
For this assignment, you can only use the Python standard library, matplotlib and pytest. Your code should work with Python 3.8 or newer.
First, we set out the problem we are solving. Next, we specify the target for your solution in detail. Finally, to assist you in creating a good solution, we state the marking scheme we will use.
1 Setting
Your lab members are looking into historical measurements of glacier size. They have asked you to write some code to make it easier to load the data and perform some basic analyses.
1.1 Glacier information
For each glacier, we record some basic pieces of information:
● its name
● a unique identifier (ID) for referring to it
● the country or other political unit it belongs to
● its type, composed of three aspects (primary classification, form, frontal characteristics)
● its location (latitude and longitude)
Additionally, we care about how the “health” of the glacier changes over time. Glaciers can grow and decrease in size. This is measured through a quantity called mass-balance. In its simplest form, it is a single number which measures the net growth or loss in a given time period. If it is positive, it means that the glacier has grown. If it is negative, it has shrunk.
1.2 Structure of the data
The data you are working has been compiled over a number of years. It is split across multiple files in CSV format. For the purposes of the assignment, we will look at two files. For more information about the whole dataset and its origin, see the appendix.
In both files, the first row is a header containing the names of the columns.
The first file (referred to as “Sheet A”) has the basic information for each glacier. It contains one row per glacier. The columns are, in order:
● political unit
● name
● identifier (WGMS_ID), made up of 5 digits
● general location (not of interest for this assignment)
● specific location (not of interest for this assignment)
● latitude, in degrees
● longitude, in degrees
● primary classification, encoded as a digit
● form, encoded as a digit
● frontal characteristics, encoded as a digit
The remaining columns are not of interest for this assignment.
The second file (“Sheet EE”) contains the mass-balance measurements taken across the years. It has one row per measurement. Each glacier can have data for multiple years. There can also be multiple measurements per year for some glaciers: sometimes, the mass-balance is recorded for different parts of the glacier, contained within specific altitudes. In those cases, these lower and upper bounds are recorded in that row. However, if the measurement refers to the entire glacier, then the lower and upper altitudes are recorded as 9999. For this assignment, you can assume that the whole-glacier measurements (with lower and upper altitude equal to 9999) for a certain year are listed after all the sub-regions for that glacier and year.
The columns named POLITICAL_UNIT, NAME, and WGMS_ID are the same as in the first file. The other columns of interest are:
● YEAR: the year the measurement refers to
● LOWER_BOUND and UPPER_BOUND: the range of altitudes the measurement refers to (as described above), in meters above sea level (m.a.s.l.)
● ANNUAL_BALANCE: the net value for the mass-balance, in millimeters water equivalent (mm.w.e.)
For example, the entries in sheet EE below would mean that the region of the Zongo glacier (with ID 15030) between 5650 and 5750 m.a.s.l. increased by 569 mm.w.e. in 1992, while the region above that (5750 - 5850 m.a.s.l) decreased by 351 mm.w.e. during the same year. The overall change is an increase of 218.
|
POLITICAL_UNIT
|
NAME
|
WGMS_ID
|
YEAR
|
LOWER_BOUND
|
UPPER_BOUND
|
ANNUAL_BALANCE
|
|
BO
BO
|
ZONGO
ZONGO
|
01503
01503
|
1992
1992
|
5650
5750
|
5750
5850
|
569
-351
|
1.3 Goal
Your goal is to provide some code that will allow your collaborators to read in this data, and start analysing it. The specific requirements are described in the next section. Your code must also check the validity of the data, as explained there.
We have already given you an outline of the code, which you have to complete. You will also need to write some unit tests to verify that the code itself is behaving as expected.
2 Your tasks
2.1 Git
To track your changes as and after you make them, you should work in a git repository. You should make commits as you go along, and give them meaningful descriptions.
The goal is that someone (you or others) can look at your commit history in the future and get a rough idea of what changes have happened. The messages should guide them in finding when a particular change was made – for example, if they want to undo it or fix a related bug. Therefore, avoid vague messages (e.g. “Fixed a bug”, “Made some changes”) or ones that don’t describe the changes at all (e.g. “Finished section 3.2”). Prefer concrete messages such as “Check the type of the arguments” or “Add tests for reading data”.
Your repository should contain everything needed to run the code and tests (see below), but no files that are not necessary. In particular, you should not commit “artifact” files that are produced by your code. Refer to the notes for how to exclude such files from your repository!
You can work on one or multiple branches, as you prefer. We will only mark the latest commit on main branch of the repository you submit.
2.2 Main code
We have given you an outline of the code which you must fill in. The code is split over two files.
glaciers.py contains the definition of two classes, Glacier and GlacierCollection. The first rep-resents a single glacier, while the second brings together all the glaciers from a dataset. The second file, utilities.py, is a place to put useful functions - there is a stub for one function you will need there.
You are free to write any additional functions or methods that you think are useful for your solution. However, your implementation must follow the interface we specify below; that is, the methods and functions we require should still be callable in the way we describe.
Users can create Glacier objects and call methods on them. However, the user will likely interact primarily through the GlacierCollection, by creating it, adding data and retrieving some analysis results. Some of the methods of that class will, internally, call methods on the Glacier class as needed.
Below is the functionality your code should include.
2.2.1 Reading in data
To create a Glacier object, one must know some basic properties: its unique identifier, name, political unit, coordinates, and the 3-digit code describing its type. These are passed to the class’s constructor:

As this example shows, the identifier, name and political unit should be passed as strings, and the latitude and longitude as numerical values. The 3-digit code should be passed as an integer.
Alternatively, users can create an entire collection by passing in the file containing basic information (“Sheet A”). The argument to the constructor should be a Path object from Python’s pathlib module. The file could be located anywhere on the user’s computer; your code should not make any assumptions about its location.
This is an example of how you should be able to create a collection:

It is up to you how the GlacierCollection keeps track internally of all the glaciers it holds.
Once the GlacierCollection is available, it should be possible to read in the mass-balance data through its read_mass_balance_data method, which should take as input another Path object pointing to the relevant sheet. This method should, in turn, call the add_mass_balance_measurement method of Glacier, which takes 3 arguments: the year, the value, and a boolean value indicating whether this is a partial (sub-region) measurement or not (see Structure of the Data above).
There are some subtleties that we must take into account because of the existence of partial measurements. If, for a particular year, a glacier only has one, whole-glacier, measurement, then that measurement should be recorded. However, if there are any measurements for sub-regions, then the total value recorded (once they are all read in) should be the sum of those measurements. In this second case, if there is also a whole-glacier measurement, then it should be ignored. Remember that we are assuming that the whole-glacier measurement will appear only after any partial measurements for that glacier and year.
2.2.2 Analysis
With the collection created, we want to implement some automated analyses. These will be accessible by calling methods of a GlacierCollection.
First, we want to have a way to find all glaciers matching a specific code. The filter_by_code method should take a 3-digit code as an integer or string, and return the names of all the glaciers with that code. For more flexibility, we may want to match several codes at once. To do this, the method should allow matching an incomplete code using the character ?. For example, if we want to find glaciers with codes where the first digit is 4 and the third digit is 9, but the second digit could be anything, we should be able to pass in the argument ”4?9” (note that in this case we will need to use a string, not an integer). A code pattern like this could contain more than one ?.
Second, we want to be able to find the nearest glaciers to a location. The find_nearest method should take as arguments a latitude, a longitude, and a number of results n, and return a list of the names of the n glaciers which are closest to those coordinates. If n is not specified, it should default to 5. To find the distance between two sets of coordinates, you should use the Haversine formula: the distance d between two points ( ) and (
 ) (with latitudes
  and longitudes
  ) is
) is

where R = 6371 is the approximate radius of the Earth in km. You should implement this computation in a function haversine_distance in utils.py, which should accept latitudes and longitudes in degrees (not radians).
Third, we want to retrieve the glaciers with the largest latest changes in mass-balance. The sort_by_latest_mass_balance method should accept an optional argument n (default: 5) and re-turn a list of n Glacier objects, representing the glaciers with the greatest change in mass-balance at the time they were last recorded (the year of those measurements may differ across the glaciers). Note that this should take into account the sign of the change: so a change of -50 is considered smaller than a change of +10. The method should also accept an optional argument reverse. If this is true, then the n glaciers with the smallest change should be returned instead.
Finally, the summary method should compute and display the following:
● number of glaciers in the collection
● earliest year of recorded mass-balance change (for any single glacier)
● percentage of the glaciers that shrunk at their last measurement, rounded to the nearest integer (so a ratio of 0.723 should be displayed as 72%).
These results should be printed in the following format:
This collection has 23 glaciers.
The earliest measurement was in 1963.
75% of glaciers shrunk in their last measurement.
For the percentage, consider only those glaciers that have had mass-balance recordings. For example, assume a collection with 5 glaciers, of which 1 has never had a mass-balance recording. Of the remaining 4, 1 had a positive change at last measurement, and 3 had negative changes. The percentage we want is then 75%.
2.2.3 Plotting
For your lab members to get to grips with the mass balance data, they would like to be able to visualise it. Your task is therefore to add a method to the Glacier class called plot_mass_balance which plots the mass balance measurements on the Y-axis against the years the measurements were taken on the X-axis.
For convenience, your lab members would furthermore like you to program a visualisation method for a GlacierCollection called plot_extremes. This method should plot the mass balance measurements against the years for the two extreme glaciers in the collection. By extreme glacier we mean the one which grew the most at its latest mass balance measurement and the glacier that shrunk the most at its latest mass balance measurement.
Both plotting methods should also label the axes appropriately and save the plot to a file. They should therefore take a file path (a Path object, as above) as an argument.
2.2.4 Validation
As with many real-world scientific datasets, the measurements can be inconsistent and contain errors. We would like our code to catch that. Similarly, we want to notify users when their methods are called with arguments that don’t make sense.
Your implementation should raise errors with appropriate error messages when encountering data that ap-pears to be wrong. At minimum, it should that that the following conditions are met when creating a glacier or a collection:
● The unique ID is comprised of exactly 5 digits
● The latitude or longitude are numbers within acceptable ranges (the latitude should be between -90 and 90, the longitude between -180 and 180)
● The year is an integer number that makes sense (e.g. not in the future)
● The political unit is a string of length 2, composed only of capital letters or the special value ”99” (indicating an unknown unit)
The validity of any arguments should also be checked when calling the methods of Glacier and GlacierCollection or the haversine_distance function. This includes, in particular, the latitude and longitude, as well as the code pattern for filter_by_code. The mass-balance value should also be a valid number.
Finally, when reading the mass-balance data file, you should check that all the glaciers referred to have already been defined (when creating the collection). Your code should throw an error if an unrecognised glacier identifier is encountered.
The error messages should be informative, and you should use an appropriate error type. Avoid messages like “Something has gone wrong” - your goal is to help the users understand what the problem is!
2.3 Tests
In addition to the main code in glaciers.py and utilities.py, you should create some tests to verify that it is behaving correctly.
You should create a file called test_glaciers.py with unit tests written for the pytest framework. Running pytest in your submission directory should find the tests, and the tests should pass.
At a minimum, your tests should cover these cases:
● Errors with appropriate error messages are thrown when invalid values are encountered (see Validation section above)
● The add_mass_balance_measurement method works correctly for both partial and whole-region data, as explained above
● The filter_by_code method works correctly for both full codes and incomplete code patterns (containing ?)
● The sort_by_latest_mass_balance method works correctly for both directions of sorting (i.e. for both values of the reverse argument)
You will likely need several tests for each of the points above to cover the necessary cases. Fixtures and test parametrisations might be a good idea in some cases.
You are of course free to add any more tests that you think make your code more robust and help you with the development!
Make sure that your submission includes all files that are needed to run the tests (for example, any sample data files if you use them).
2.4 Directory structure and submission
You must submit your exercise solution to Moodle as a single uploaded gzip format archive. (You must use only the tar.gz, not any other archiver, such as .zip or .rar. If we cannot extract the files from the submitted file with gzip, you will receive zero marks.)
To create a tar.gz file you need to run the following command on a bash terminal:

The folder structure inside your tar.gz archive must have a single top-level folder, whose folder name is your UCL candidate number, so that on running

this folder appears. This top level folder must contain all the parts of your solution (the repository with your files). You will lose marks if, on extracting, your archive creates other files or folders at the same level as this folder, as we will be extracting all the assignments in the same place on our computers when we mark them!
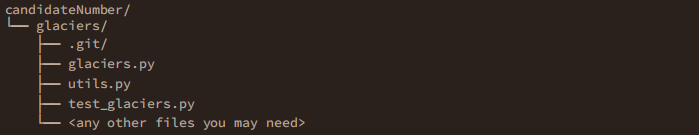
Inside your top level folder, you should have a glaciers directory. Only the glaciers directory has to be a git repository. Within the glaciers directory, you should have the files glaciers.py, utils.py and test_glaciers.py, as well as any other files you need.
You should git init inside your glaciers folder, as soon as you create it, and git commit your work regularly as the exercise progresses. We will only mark the latest commit on the main branch of the repository, so be careful about leaving changes on other branches or uncommitted. Due to our automated marking tool, only work that has a valid git repository, and follows the folder and file structure described above, will receive credit.
You can use GitHub for your work if you wish, although we will only mark the code you submit on moodle. Due to the need to avoid plagiarism, do not use a public GitHub repository for your work - instead, use the repository that you’ll get access to by accepting this invitation: https://classroom.github.com/a/8aSenWI0 which, after you accept the permissions, will create a repository named glaciers-<gh_username>.
In summary, your directory stucture as extracted from the candidateNumber.tar.gz file should look like this:
3 Getting help
This assignment is designed to check your understanding of the concepts we have covered in the class. You may find it useful to review the lecture notes, classroom exercises, other resources linked from Moodle, and the official Python docs. There are many places you can find advice for coding on the Internet, but make sure you understand any code that you take inspiration from, and whether it makes sense for your purposes.
You can ask questions about the assignment on the Q&A Forum on Moodle. If we receive repeated or very important questions, we will create a Frequently Asked Questions post to collect the answers, and keep it updated. You can also email us your questions at [email protected] or book an office hours slot.
4 Marking scheme
Note that because of our automated marking tool, a solution which does not match the standard solution structure defined above, with file and folder names exactly as stated, may not receive marks, even if the solution is otherwise good. “Follow on marks” are not guaranteed in this case.
You can add more functions or files (e.g., fixtures) if you consider it’s appropriate. However, you should not change the name of the provided files and functions.
● Version control with git (15%)
○ Sensible commit sizes (5 marks)
○ Appropriate commit messages (5 marks)
○ “Artefacts” and unnecessary files not included in any commit (5 marks)
● Data loading (15%)
○ Basic glacier data (Sheet A) (5 marks)
○ Mass-balance data (Sheet EE) (5 marks)
○ Correct handling of sub-regions for mass-balance (5 marks)
● Analysis methods (20%)
○ Sorting by mass-balance (4 marks)
○ Finding nearest glaciers (2 marks)
○ Implementation of distance function (2 marks)
○ Filtering by full code (2 marks)
○ Filtering by incomplete code pattern, with ? (2 marks)
○ Summary of collection (3 marks)
○ Plots (5 marks)
● Validation (20%)
○ Improper identifier format (2 marks)
○ Improper political unity (2 marks)
○ Improper year (2 marks)
○ Improper latitude or latitude (4 marks)
○ Improper code or code pattern (3 marks)
○ Improper mass-balance value (2 marks)
○ Unrecognised identifier when reading mass-balance data (3 marks)
○ Errors have appropriate messages and type (2 marks)
● Tests (25%)
○ Tests checking that mass-balance is recorded correctly, handling whole-region and sub-region measurements as described (10 marks)
○ Tests checking that filtering works correctly for both full codes and incomplete code patterns (5 marks)
○ Tests checking that sorting works correctly for both ascending and descending directions (5 marks)
○ At least two negative tests, checking the handling of improper inputs (5 marks)
● Style and structure (5%)
○ Good names for variables, functions and methods (3 marks)
○ Good structure, avoiding repetition when possible (2 marks)
Appendix: Additional information about the data
The data files distributed with the assignment are a simplified version of the datasets of the World Glacier Monitoring Service. Those datasets are released as open access under condition of attribution:
Zemp, Michael, Samuel U Nussbaumer, Isabelle Gärtner-Roer, Jacqueline Bannwart, Philipp Rastner, Frank Paul, and Martin Hoelzle, eds. 2021. Global Glacier Change Bulletin No. 4 (2018-2019). Zürich, Switzerland: ISC(WDS)/IUGG(IACS)/UNEP/UNESCO/WMO, World Glacier Monitoring Service. ht tps://doi.org/10.5904/wgms-fog-2021-05.
You can find more information on the website of the organisation, including specifically about the data.
The original dataset comprises a number of files (sheets), of which we have only used two in this assignment. The remaining sheets describe additional information about the state of the glacier and changes to it, as well as more details about the mass-balance.
If you are interested, you can find more information about what mass-balance is, and what the units used (millimeters water equivalent) mean, at the site of the US Geological Survey.
The exercise makes some simplifying assumptions which may lead to inaccuracies, so be wary of drawing real, accurate conclusions! We have also slightly edited the contents of the files to make them more consistent with the description.
