关键词 > PPHA34600
PPHA 34600: Program Evaluation Spring 2024 Final Exam
发布时间:2024-05-18
Hello, dear friend, you can consult us at any time if you have any questions, add WeChat: daixieit
PPHA 34600: Program Evaluation
Spring 2024
Final Exam
Due: May 20th at 9PM (Chicago time) to Gradescope via Canvas
Instructions
This final exam consists of three files: (1) this document with instructions and questions; and (2) two datasets which you will use to answer the questions below. You must work alone. You may consult Canvas, and may post clarifying questions to Ed Discussion (up to 24 hours before the deadline), but you may not discuss the exam with anybody else, nor share any code. You may not use any materials from previous years of this course, but otherwise this exam is entirely open book / open note / open internet. You may use LLMs such as ChatGPT. Regardless of which of these permitted sources you may choose to consult, your answers must be your own work, written entirely in your own words.
You should submit written answers, your code and output/results for the data analysis as one single PDF. Exams must be submitted in PDF format. You must use R and we recommend that you use RMarkdown or knitr, which will allow you to intersperse your code and written answers. Note that you are primarily being graded on your written answers.
Exams must be turned in via Gradescope on Canvas; no late submissions will be considered for any reason and any late submissions will receive an automatic 0. Late tokens cannot be used for the final. Due to time constraints, there will not be a regrade opportunity for the final exam.
There is a word limit of 300 words for each (sub)question. Failure to comply with these limits will result in a 5 point deduction per (sub)question. These limits do not include code, equations, or text within figures/tables.
Part 1
In an effort to improve worker job satisfaction, a large corporation offered the Meditation to Improve the Next Day (MIND) program to their employees. This program gave employees time to meditate and tools to help them manage stress and improve communication. Because the CEO of the corporation is a Harris alumnus, they randomly offered spots in MIND to half their employees. However, attendance was not mandatory for employees offered a spot. The corporation would like you to help them evaluate whether this program was successful in its goal of improving job satisfaction.
Part 1A
The corporation provides you with the data set final exam data q1.csv, which contains information on whether each worker was randomly offered a spot in MIND (mind offer) and whether they attended (mind takeup). Oddly, the benevolent program evaluation overlords have also given you not just the ob-served job satisfaction for each worker, but also the potential outcomes for each worker under attendance (potential satisfaction 1) and under no attendance (potential satisfaction 0), measured on a scale from 0-100. First, write down the equation for the average treatment effect (ATE) of MIND attendance on job satisfaction. Next, use this miraculous dataset to calculate the ATE, rounded to the nearest tenth (make sure to include your R code) and interpret this value.
Part 1B
The CEO of the corporation thinks this is interesting but would also like to understand some things about the offer. As a first step, she would like you to compute the take-up rate: that is, what share of people who were offered a spot in the MIND program eventually attended? She would also like to know what share of people who were not offered a spot in the MIND program did eventually attend? Next, the CEO tells you she would like to know the effect of offering the MIND program on job satisfaction. What is the CEO trying to get you to measure? Write down the equation for the CEO’s treatment effect of interest. Use the miraculous dataset to estimate this object in R, rounded to the nearest tenth and interpret this value. Explain why this value is the same or different than the effect you calculated in Part A.
Part 1C
Next, the CEO asks you what the effect of the MIND program was for those who attended. Using the offer as an instrument for attendance, estimate the impact of attendance on job satisfaction (and its standard error) and interpret your estimate. The CEO would also like to know what treatment parameter this analysis produces. For whom is this estimate valid? Be specific.
Part 1D
Being a well-trained Harris alumnus, the CEO points out a potential problem with your instrument. She notes that, while there is a first stage effect of the offer on take-up, there is a strong correlation between the offer and job satisfaction. The CEO suggests that this correlation implies your instrument is not valid. Are the CEO’s concerns warranted? Explain why or why not.
Part 1E
Based on your estimates, the CEO would like you to advise them on whether they should continue the MIND program in its current opt-in form (assume that the only thing the CEO cares about is job satisfaction. If only!) Is this a good idea? Why or why not? Next, the CFO of the corporation – an alum of a different, unnamed public policy school – thinks it would be a good idea to make the MIND program mandatory for all employees. Is this a good idea? Why or why not? Finally, advise the board of directors: would you (A) eliminate the MIND program altogether; (B) run an optional version of the program; or (C) make the program mandatory?
Part 2
The local neighborhood group, Hippies Yearn for Deciduous Environments (HYDE), is advocating for a new tree planting campaign around Chicago. Since they are not very good hippies, they would like to decide whether this is a good idea by using data on whether tree planting efforts in Texas improved local housing values. In particular, they have annual data on average housing prices (measured in thousands of US dollars) from Austin, Dallas, and Houston from 1995 to 2000. Austin planted trees in 1997, Houston planted trees in 1999, and Dallas never planted trees. You can assume that the tree planting “treatment” happens on the first day of the relevant year, and that the trees are not cut down (i.e., the city remains treated for the remainder of time).
Part 2A
As a first step, HYDE would like you to examine Austin and Dallas alone. Being particularly nerdy, one of the hippies managed to estimate a difference in difference model with these two cities. They show you the following regression results:
Housing valueit = 50 + 8 Ever Treesi × Postt − 40 Ever treesi + 15 Postt
where i refers to city and t refers to year. Using this output, calculate average housing values for Austin and Dallas both in the period before Austin planted trees and in the period after Austin planted trees (you should calculate four values). Make sure to show your work.
Part 2B
What is the treatment effect from this regression output, and what treatment parameter does it represent? What assumption do you need in order for this estimate to represent a causal effect?
Part 2C
HYDE are interested in understanding how the effect of treatment varies over time. The exceptionally nerdy hippie shows you the following data set:
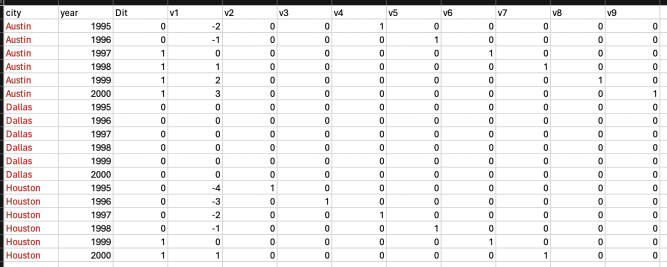
Being sloppy, the hippie forgot to label some of their variables (and the outcome data are confidential and so cannot be shared with you). But based on the patterns in the data set above, what type of analysis are they proposing? How would you interpret the coefficient on v7?
Part 2D
Finally, the hippie proposes using the following regression.
Housing valueit = τTreesit + αi + δt + ϵit
Describe the four comparisons that would go into the estimate of τ . Are any of these comparisons concern-ing? If yes, which one(s). Explain why. If no, explain why not.
Part 3
The Rwandan Government has hired you to evaluate the impact of their efforts to expand irrigation on agricultural productivity.
Part 3A
They first want to know about average agricultural yield (measured in kg of crops produced per hectare) on farms with and without irrigation. Use words and math to outline this comparison. Does this comparison represent the causal effect of irrigation on yields? Why or why not?
Part 3B
The Minister of Agriculture has more information for you. They explain that access to irrigation is often tied to a set of new canals: if a farm lies uphill from a canal, the farm is not irrigated; if a farm lies downhill from a canal, it is irrigated. The Ministry has been carefully collecting data on distance above (expressed as positive distances in the data) or below a canal for each farm (expressed as negative distances in the data). They caution you that while they don’t have data on this, they anecdotally understand that distance to the river is associated with farmer wealth: poorer farmers typically live close to the river, while richer farmers tend to live further away from the river. They want to make sure you do not mistake this for the causal effect of irrigation on yields. Using this information, propose a research design that will estimate a casual effect of irrigation on yields. Write down the corresponding estimating equation. (The Minister is very busy: please only describe the design and provide the estimating equation; please do not discuss identifying assumptions here.)
Part 3C
The Ministry gives you a dataset with which they would like you to perform your proposed analysis (final exam data q3.csv). A data dictionary explaining each column is provided below.
Column Meaning
farm id Identifier for farm
distance above canal Distance in meters above the canal (negative values indicate meters below canal)
irrigation Indicator for whether the farm is irrigated
age Age of primary farmer
household size Number of household members
yield kgperhectare Crop yield in kg / hectare
Using these data, first plot a scatterplot of the relationship between irrigation and distance to the canal (Hint: make sure your graph contains fewer than one dot per farm for the purpose of legibility). Please explain to the Ministry what you find in this plot, whether it supports the analysis you proposed above, and why or why not. If this invalidates your previously-proposed analysis, please propose a new approach.
Using either your previously-proposed approach or your newly-proposed approach, conduct your analysis. Note that the Minister is very busy and overwhelmed, and doesn’t want to see any supporting evidence beyond the plot he already asked for, so just estimate the causal effect of irrigation on yields per your approach. What is your estimate of the causal effect of irrigation on yields? What treatment parameter does this represent?
Part 3D
The Ministry would like to know what types of farmers are benefiting from irrigation. Using the data you have on farmer age and household size, plot the relationship between these farmer characteristics and distance above the canal. Do these figures increase or decrease your confidence in the identifying assumption(s) underlying the analysis you conducted in 3C? Why?
Part 3E
The Ministry would like to know the number of farmers who may have benefited from irrigation. Create a figure which shows the density of farmers by distance above the canal. Does this figure increase or decrease your confidence in the identifying assumption(s) underlying the analysis you conducted in 3C? Why?
BONUS
Find an example of a popular press article describing a study using causal language, when, given what you’ve learned in this quarter, this is likely not appropriate. Use a few sentences to describe the study and the main problem of the study through the lens of this course. Attach the article in PDF form to your exam submission. Remember that you can only submit one PDF to Gradescope, so make sure this article is included at the end of your submission in the same PDF.
