关键词 > PHYS5032
PHYS5032 Techniques for Sustainability Analysis Homework Sheet 4: Integration
发布时间:2024-05-18
Hello, dear friend, you can consult us at any time if you have any questions, add WeChat: daixieit
PHYS5032 Techniques for Sustainability Analysis
Total points: 20
Homework Sheet 4: Integration
Scenario: You are asked to assist the transport authorities to redesign the railway platform at Redfern station. The transport authority would like to understand how many people will enter the newly designed platform within a certain time, and also whether the scheduled train departures are sufficient for all people to leave the station by train.
Throughout this exercise, it is up to you whether you use mathematical or numerical integration. But: If you can, use mathematical integration.
Round all of your results and present only integer numbers. If necessary, justify why you round results up or down.
Part A: Passengers arriving at the platform
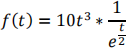
Assume that the platform is completely empty at the beginning of the observed timeframe. The modelers have measured the influx of people onto the platform in people per second. They observed that as the platform fills up, the rate of people entering the platform decreases (due to overcrowding). For peak use times (mornings and evenings), the modelers have concluded that the influx of people f(t) (number of people arriving on the platform per second) can be described by the function

Note that this function measures the people that arrive at the station at time t in persons per second. The variable t is given in seconds.
1. (A) (1.5 points) Calculate amount of people that are on the platform after five minutes. For this, assume that no people are on the platform at the beginning of the timeframe, and that the influx of people is perfectly described by the above function. Write a short paragraph explaining why you chose mathematical integration or numerical integration.
2. (A) (1.5 points) If you chose mathematical integration in the first question, use numerical integration with a step length of 1 second and compare the results. What is the percentage deviation between the mathematical and the numerical solution?. (within 400 words).
Part B: Passengers leaving the platform by train
The station design is intended to allow one train to leave every five minutes which should transport all passengers that are waiting on the platform. As the train pulls up and opens its doors, the number of passengers that enter the train is modeled in two different steps. The rate of passengers entering the train is again measured in persons per second.
a) As the train opens its doors and the passengers enter, the rate of passengers entering the train increases for the first 6 seconds and is described by
b) After 6 seconds the level of people getting on the train stays constant at the level that is has reached at 6 seconds according to the function in a).
3. (A) (2 points) How many people are getting on the train within the first 6 seconds of the train being at the platform?
4. (A) (2 points) The train is scheduled to remain at the platform for 15 seconds in total. How many people can get on the train within this time? Is this stopping time long enough for all people that are waiting on the platform to get on the train?
5. (A) (2 points) How long does the train have to stay at the platform for all people to enter the train? Remember to round your results to integer numbers, and do so in a way suitable for the problem at hand.
6. In your own words (A) (2 points) For what effects is integration the right tool to carry out your analysis? In your response, it is sufficient to discuss phenomena that span over a certain time frame (similar to what we discussed in the lecture). You can also use different examples if you wish, but this is not necessary. (within 400 words).
Part C: Integrations and Greenhouse gas emissions
Greenhouse gases, in particular CO2, are the drivers of climate change. In order to limit future warming we must reduce global CO2 emissions. Choose two or more countries. Assuming all countries are willing to reduce CO2 emissions, the goal of this exercise is to propose a fair agreement for the countries you choose to reduce CO2 emissions. From IPCC, emissions will need to be reduced by 45% by 2030 and 100% by 2050, comparing to 2010 level. The global carbon budget therefore is estimated to be 500Gt. The project starts by analyzing historic emissions of the selected countries. Historic emission and population data are available here.
7. (A) (2 points) What are the historical and per-capita emissions for the chosen countries/regions? Can you plot the trend? Which country is more responsible for current atmospheric CO2 levels, why? (within 400 words).
8. (A) (4 points) Would you be able to provide a short proposal on a fair plan for both countries to reduce emissions. What is your proposal based on? Have you considered historic emissions, per-capita emissions, or current emission share? (within 800 words).
9. (A) (3 points) Do you recognize the current correlations between CO2 emissions and standard of living? Please provide your reflections on it. (within 400 words).
