关键词 > CITS2401
CITS 2401 Computer Analysis and Visualisation Project 2
发布时间:2024-05-13
Hello, dear friend, you can consult us at any time if you have any questions, add WeChat: daixieit
CITS 2401 Computer Analysis and Visualisation
Project 2
Data Analysis and Visualisation of Malicious Credit Card Transaction
Worth: 15% of the unit
Submission: (1) your code and (2) your data analysis and visualisation report on the quiz server. Deadline: 24th May 2024 5 pm
Late submissions: late submissions attract a 5% raw penalty per day up to 7 days (i.e., 31st May 2024 5 pm). After that, the mark will be 0 (zero). Also, any plagiarised work will be marked zero.
1. Outline
In this project, we will continue from our Project 1 where we implemented a malicious credit card transaction detection system. But instead of implementing the features (which we completed in Project 1), we will now focus on data analysis and visualisation skills to better present what our datasets contain. For this project, you will be given a dataset (CreditCard_2024_Project2.csv) that contain credit card transactions that are already labelled normal or malicious. Your task is to perform the following steps (more details in the tasks section):
• Data analysis
• Data visualisation
• Write data analysis and visualisation report
• (bonus) use machine learning to implement detection
Note 1: This is an individual project, so please refrain from sharing your code or files with others. However, you can have high-level discussions about the syntax of the formula or the use of modules with other examples. Please note that if it is discovered that you have submitted work that is not your own, you may face penalties. It is also important to keep in mind that ChatGPT and other similar tools are limited in their ability to generate outputs, and it is easy to detect if you use their outputs without understanding the underlying principles. The main goal of this project is to demonstrate your understanding of programming principles and how they can be applied in practical contexts.
Note 2: you do not necessarily have to complete project 1 to do this project, as it is more about data analysis and visualisation of the datasets you are given.
2. Tasks
To begin, you need to define a main(filename, filter_value, type_of_card) function that will read the dataset and store the transaction records in data and call the below functions to display appropriate results.
Sample Input:
main('CreditCard_2024_Project2.csv', 'Port Lincoln', 'ANZ')
Task 1: Data Analysis using NumPy Mark: 15
Answer the following 5 NumPy related tasks for data analysis. These will require use of NumPy functions and methods, matrix manipulations, vectorized computations, NumPy statistics, NumPy where function, etc. To complete this task, write a function called task1(data, filter_value, type_of_card), where data contains all records from the dataset and filter_value is an area name and type_of_card is the name of the card provider. The function should return a list containing values from the following questions.
Return all results rounded to two decimal points.
Input:
cos_dist, var, median, corr, pca = task1(data, 'Port Lincoln ', 'ANZ ')
output:
[0.06, 1337142.45, [5.75, 7.21], -0.06, [0.73, 0.81, 0.7, 0.93, 0.72, … ]]
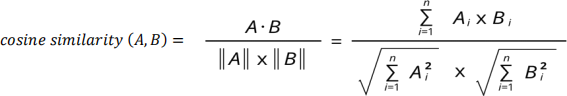
i. cos_dist: Calculate cosine distance between normal and malicious transactions based on IP_validity_score.
Formula:
cosine distance = 1 − cosinesimilaTity
Output:
print(cos_dist) = 0.06
ii. var: Filter transactions based on certain geographical area e.g. Port Lincoln and calculate and display the variance of transaction amount for a specific area. Note: use the Actual area column from the dataset. Use sample variance formula for calculation.
Output:
print(var) = 1337142.45
iii. median: Filter data based on Type_of_card and then calculate the median of Authentication_score value for transactions that are in the lower 25th (inclusive) and upper 75th (inclusive) percentile.
Output:
print(median) = [5.75, 7.21]
iv. corr: Filter malicious transactions where Actual and Origin places are different. Calculate dot product between Authentication_score and IP_validation_score and then perform correlation between the resultant vector and Amount column.
Output:
print(corr) = -0.06
v. pca: Create a N x 5 matrix where N is number of rows in the dataset and 5 is the number of columns, we will call these features (Transaction_type, Entry_mode, Amount, Authentication_score, and IP_validity_score) (before that you need to convert all string values to numerical values. You can assume there will always be 3 Transaction_type and use the following values - ATM: 1, EFTPOS: 2, and Internet: 3 and four Entry_mode - Magnetic Stripe: 1, Manual: 2, Chip Card Read: 3, and NFC: 4). Calculate principal component analysis (PCA) to reduce the dimensionality of data to N X 1.
The algorithm for PCA is:
a) Standardize the data along all the features (subtract mean and divide by standard deviation over the feature dimension).
b) Calculate the covariance matrix for the features
c) Perform eigen decomposition on the covariance matrix to get eigenvectors (principal components) and eigenvalues
d) Sort the eigenvectors based on their eigenvalues from highest to lowest
e) Select top k eigenvectors (k=1)
f) Transform the data using the selected eigenvectors (dot product of eigenvectors and Standardized data in step a)
Output:
print(pca.shape) = (10000, 1)
print(pca[0:5]) = [0.73, 0.81, 0.7, 0.93, 0.72]
Task 2: Data Analysis using Pandas Mark: 5
Answer the following 2 Pandas related tasks for data analysis. To complete this task, write a function called task2(data), where data contains all records from the dataset. The function should return a list of lists containing values from the following questions. Return all results rounded to two decimal points.
Input:
Q1, Q2 = task2(data, pca)
output:
[[3222, 3172, 3196, 3083, 3257, …], False]
i. Using pandas, filter all transactions that have an Amount lower than the mean Amount of all malicious transactions.
Output:
print(Q1[:5]) = [3222, 3172, 3196, 3083, 3257]
ii. Using pandas find whether there are any NaN values in the dataset or not. If there are any NaN, replace them with zeros. Return a Boolean True if there were any NaN or False otherwise.
Output:
print(Q2) = False
Task 3: Data Analysis using SymPy Mark: 10
Answer the following 2 SymPy related tasks for data analysis. These will require use of SymPy functions. Return all results rounded to two decimal points. To complete this task, write a function called task3(data, pca), where data contains all records from the dataset and pca is the return output from task1(). The function should return a list containing values from the following questions. Return all results rounded to two decimal points.
Input:
Q1, Q2 = task3(data, pca)
Output:
[[[1080072003.5, …], [77878965.5, … ]], -75000.0]
i. Filter normal and malicious transactions and calculate the derivatives of Amount for both using the following formula.
expr = 2.5x**3 + 3*x**2 + 3.5*x + 5
output:
print(Q1[0][0], Q1[1][0])=
1080072003.5 77878965.5
ii. Solve the following equation for a where x values are taken from the pca values then plot the line over scatter plot of the pca values.
eq = ax + 3
Output:
print(Q2) = -75000.0
Note: Return all results rounded to two decimal points. However, do not round during any calculation. Trailing zeros can be ignored e.g. 1.50 will be 1.5.
Task 4: Data Visualisation using matplotlib Mark: 20
You must demonstrate following 5 matplotlib related skills for data visualisation. To complete this task, write a function called task4(data), where data contains all records from the dataset. The function should display the following plots. The presentation of the visualisations (e.g., customising labels, points etc.) will determine your fluency in data visualisation skills.
i. Plot Amount values using bar plot for transactions where IP_validity_score is below 2 and Authentication_score is below 1.5. Use different colours for normal and malicious transactions.
ii. Extract data from malicious transactions for different Type_of_card separately and display their total Amount using a pie plot. Number of different Type_of_card will vary.
iii. Extract data from all transactions for different Entry_mode separately and display the IP_validity_score values using a boxplot. Number of different Entry_mode will vary.
iv. Create a N X 2 matrix where N is number of transactions in the dataset, 2 is the index for Authentication_score and IP_validity_score values. Plot the matrix using scatter plot.
v. Create a colour code using the values in the matrix created in QV - Task 1 (pca). Plot
Authentication_score values where values are over 8 as a bar plot using the corresponding colour codes. [You can use the rounded value of pca to create the colours].
Task 5: Write a summary report Mark: 5
Write a summary report for your data analysis and visualisation. The report presents your findings and recommendations using above findings and articulate your understanding of the datasets. You should clearly explain methodology (how), and results (what). The report should also address how the data analysis might extract some inherent patterns in the dataset. Use appropriate style to present your explanation in a story like format that will enable the reader to understand how the above data analysis might help better understand malicious credit card transaction detection. Add your suggestions. Report should be within 1200 - 1500 words excluding code.
Note: Ensure to include your name and student ID in the report!
Task 6 (Bonus): Apply machine learning techniques Mark: 5
Research and build a malicious transaction detection model using machine learning (ML). You can implement a ML-based model, such as SVM, decision tree, or neural network, to classify the data into normal or malicious categories. To achieve this, you can use additional feature calculation and any necessary numerical conversion of string data. You should also split the data into training and testing sets, train your model, and evaluate its performance using metrics such as accuracy, precision, recall, and F1-score.
Your bonus marks can be used to cover shortage in marks for this or other assessments. Note that your final grade can't be more than 100%.
Above tasks (tasks 1 - 6) are all due 24th May 2024 5pm
3. Submission
Submission items (1) and (2) - Code and Report
Submit your whole code (tasks 1 to 6) in the quiz answer box by the due date (24th May 2024 5pm, drop dead due date 31st May 2024 5pm with 5% raw penalty per day), containing all functions, objects etc., as well as attaching the python file containing all the code you wrote for this project. You should name the file as [student id]_P2_code.py. For example, if your student ID is 12345678, then your filename is 12345678_P2_code.py.
Final remarks: make sure you have the module docstring for your project code, indicating your name, your student ID number along with the description of the project.
Similarly, submit your report as a PDF format, named 12345678_P2_report.pdf ONLY in the project 2 report submission portal on the quiz server.
Fail to follow these instructions will be regarded as NO SUBMISSION (i.e., you will receive 0 for this project) .
