关键词 > STAT340
STAT340 Final
发布时间:2024-05-11
Hello, dear friend, you can consult us at any time if you have any questions, add WeChat: daixieit
STAT340 Final
Multiple Choice 2pts each
MC1
Let X be a random variable with sample space Ω={0,1,2,3,4},and let P(0)=P(4)=1/8,
P(1)=P(3)=1/4.Which of the following is closest to Var(2X)?(Note:the numbers have been intentionally chosen to make the calculation easy to do by hand,if you find the calculation too difficult,double check you're
using the right approach)
a.2
b.4
c.6
d.8
e.10
MC2,3
You have a sample of 100 numeric observations that makes the following density plot.
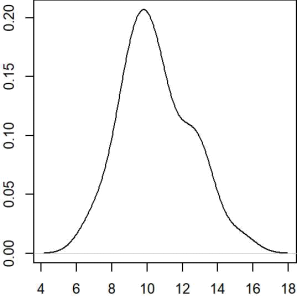
You construct a 95%confidence interval for the mean μ.Which of the following is closest to the width of the interval?(Note:the width is the difference between the upper and lower bounds)
a.0.1
b.0,2
c.0.4
d.0.8
e.1.6
You give your only copy of the data notebook to your clumsy friend who accidentally spills coffee all over it.The coffee randomly destroys 75%of your data.If your friend uses the remaining data to make a new confidence interval,how does the width of the new interval compare with the original?
a.Not enough information to determine
b.About 75%larger than the original
c.About 75%smaller than the original
d.About half of the original
e.About double the original
MC4
The probability that a sensor fails in a year is 0.01.What is this probability in odds?
a.1/100
b.1/99
c.99/100
d.99/1
e.100/1
MC5
You roll two fair 6-sided dice.Given at lease one of the dice is a 3,what is the probability the sum is 7?
a.1/6
b.1/7
c.1/11
d.2/11
e.1/18
MC6
Match the following to best description (using each exactly once):R²,F-statistic,√MSE,RSS,TSS.
A. :Ordinary loss function
b. :Used to compare with a null model
C. :Percent variation explained by model
d. :Total amount of variation in data
e. :Estimate of prediction quality
MC7
You have a coffee dataset with samples of various coffees from Latin America.It contains the following variables:
· taste:a numerical measurement of taste from 0-10 (based on expert judges)
· pH:the pH level of the coffee,typically a numeric value between 4-6
· roast:the level of roasting,with possible values light,medium,dark
· country:the country of origin,with possible values Colombia,Peru,or Brazil
If we fit a multiple linear regression model with formula taste~1+pH+roast +country to predict taste, how many coefficients will be estimated in the model?
a.6
b.7
c.8
d.9
e. 10
MC8
Which of the following can NOT fix observed nonlinearity in a residual v.fitted plot?
a.Taking a transformation of X
b.Taking a transformation of Y
c.Adding a higher power term (e.g.X²)
d.Adding an interaction term (e.g.β;XjX₄)
e.ALL of the above could fix it
MC9
The following shows a set of 4 models you're testing out (one of which is the null model)and their corresponding ROC curves.
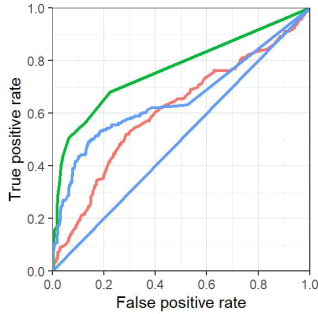
Using one of these four,what's the best possible power you can achieve at the standard a =0.05 significance level?Choose the closest response.
a.0.1
b.0.3
c.0.5
d.0.7
e.0.9
MC10
Which of the following are NOT valid for performing variableselection? Choose ALL that apply!
a.Comparing candidate models using AlC
b.Comparing candidate models using R²
c.Comparing candidate models using adjusted R2²
d.LASSO regression
e.RIDGE regression
Short Answer 4pts each
SA1
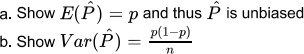
Let X~Binomial(n,p)and let  be the standard binomial p estimator.(You can use well known binomial formulas)
SA2
A fair coin is tossed 3 times.Assume independence of trials.In case you need it,a list of all possible outcomes is
provided below
|
HHH HHT HTH HTT THH THT TTH TTT |
Let events E,F,G be defined as follows:
E:The first toss is a head F:At least 2 heads occur overall G:Exactly 2 heads occur,and they occur successively (i.e.immediately one after the other)
a.Are events E,F independent?
b.Are events E,G independent?
SA3
A logistic model is fit predicting y from x.The following plot shows the fitted logistic curve and the threshold for
predicting yi =1.
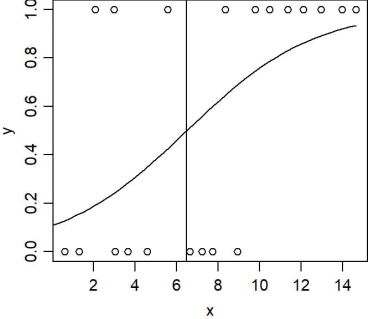
a.Fill in the table of outcomes (aconfusion matrix).
|
|
Predict 1 |
Predict 0 |
|
Y= |
|
|
|
Y=0 |
|
|
b.What is the sensitivity (i.e.power)of this model?
c.What is the specificity (i.e.1-a)of this model?
d.What is the overall accuracy of this model?
SA4
SA4 and SA5 are based on the crabs dataset from MASS.These are the columns of interest:
· species:a categorical variable with 2 levels B for blue and o for orange
· sex:a categorical variable with 2 levels M for male and F for female
· rear.width:a numeric variable measuring the width of the rear
· carapace.length:a numeric variable measuring the length of the carapace
Below we show the relevant output lines of a multiple linear regression fit on the data.
|
##Coefficients: ## ##(Intercept) ##speciesc ##sexM ##rear.width ##species0:sexM ##sexM:rear.width ##--- ##Signif.codes: ## |
Estimate Std.Error t value Pr(>|t|) -1.178244 0.657723 -1.791 0.0748 0.007671 0.284872 0.027 0.9785 -6.726915 0.962272 -6.9914.29e-11 * 求 * 2.412279 0.052232 46.184 <2e-16 来来水 -0.186890 0.378737 -0.493 0.6222 o.994374 0.078090 12.734 <2e-16*** 0'***'0.001 '**'0.01'*'0.05 '.'0.1 ''1 |
|
##Residual standard error:1.238 on 194 degrees of freedom ##Multiple R-squared: 0.9705,Adjusted R-squared: 0.9698 ##F-statistic: 1278 on 5 and 194 DF, p-value:<2.2e-16 |
|
a.At the standard a =0.05,which variables were significant?Interpret one of these coefficients. b.Construct a 95%confidence interval for the sex effect and interpret it.
c.What percent of the change in Y is explained by the model?
d.For a male blue crab with rear width of 10,what is the predicted mean carapace length?
SA5
Continuing with the crabs dataset from the previous question,we can also try using a LASSO approach to do
variable selection and pick out the most important predictors.The output is shown below (note here log defaults to
natural log,i.e.base e).

|
##7 x 1 sparse Matrix of class "dgcMatrix" ## s1 |
|
|
##(Intercept) ##species0 ##SexM ##rear.width ##species0:sexM ##species0:rear.width ##sexM:rear.width |
-1.51973763 -0.04919571 -5.90727492 2.43907352 -0.09830895
0.92709126 |
a.How does this model compare with the previous one?Were any variables found to not be useful?
b.What is the optimal value of lambda?
c.At this optimal lambda,what is the estimated MSE?
d.Would a model using a lambda of 1/e tend to be more overfit or underfit compared to our optimal lambda model?Explain your reasoning.
