关键词 > HAD7002H
HAD7002H: Causal Inference Assignment 1
发布时间:2024-05-06
Hello, dear friend, you can consult us at any time if you have any questions, add WeChat: daixieit
HAD7002H: Causal Inference
Assignment 1
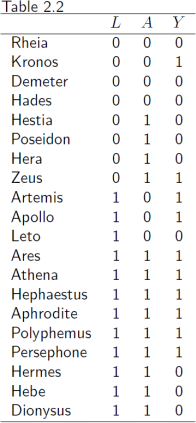
The assignment is due May 7, 2024 before the class, via Quercus. Please return your answers in a single pdf file. As the datasets, we use H & R Table 2.2 and National Health and Nutrition Examination Survey Epidemiologic Follow-up Study (NHEFS), which can be both found from R package causaldata as datasets greek_data and nhefs_complete.
1. (a) Based on the Table 2.2 data below, calculate the crude and standardized risk dif- ferences. Compare and interpret the results. Here we do non-model based stan- dardization, using empirical proportions as inputs in the standardization formula. Point estimates are sufficient, we will cover calculation of confidence intervals and other uncertainty estimates later.
(b) Fit an appropriate regression model for the outcome, and use it to calculale risk difference using model-based standardization. In the model, you can include an interaction term between the exposure and covariate, or leave it out. Try both models, and see if it makes a difference. With a saturated model, you should be able to verify the result in (a) exactly.
2. In the NHEFS data, we are interested in smoking cessation between 1971 (baseline) visit and 1982 (follow-up) visit as the exposure, and weight change between 1971 and 1982 as the outcome. Everyone in this dataset was a smoker at baseline. As potential confounders, we consider age, sex, race, weight at baseline, college education or more (dichotomized), and daily number of cigarettes smoked at baseline.
(a) Calculate the crude and standardized risk difference between quitting and not quitting. Compare and interpret the results. As you have to adjust for multiple covariates, some of these continuous, you have to use model-based standardiza- tion. Please eplain and justify your modeling choices.
(b) Using an appropriate stratified standardization formula, and appropriate model(s), investigate whether there was effect modification by sex.
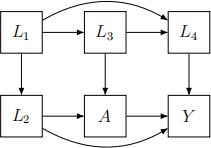
3. For the following questions please identify all paths between A and Y and write out the set of variables that satisfy the backdoor criterion.
(a) Consider the causal DAG below to write out the paths and the required set.
(b) Draw a causal DAG corresponding to the R code of simex3.r below. Identify paths between A and Y and the required covariates set.
sim ex 3 . r <− function ( )
{
set . seed ( 1 2 3 )
probL1 <− 0 . 1
L1 <− rbinom ( n = 1 0 0 0 , s i z e = 1 , pro b = probL1 ) probL2 <− 0 . 1 + 0 . 1 ∗L1
L2 <− rbinom ( n = 1 0 0 0 , s i z e = 1 , pro b = probL2 ) probL3 <− 0 . 2 + 0 . 2 ∗L2
L3 <− rbinom ( n = 1 0 0 0 , s i z e = 1 , pro b = probL3 ) probL4 <− 0 . 5 − 0 . 1 ∗L1
L4 <− rbinom ( n = 1 0 0 0 , s i z e = 1 , pro b = probL4 ) probA <− 0 . 1 + 0 . 1 ∗L2 +0.1 ∗L3 +0.1 ∗L4
A <− rbinom ( n = 1 0 0 0 , s i z e = 1 , pro b = probA ) probY <− 0 . 1 + 0 . 2 ∗L1 +0.2 ∗L2 +0.3 ∗A−0.1 ∗L4
Y <− rbinom ( n = 1 0 0 0 , s i z e = 1 , pro b = probY )
out <− cbind ( L1 , L2 , L3 , L4 , A, Y)
data . frame ( out )
}
4. A hypothetical SARS-CoV-2 Vaccine Trial randomized participants to a vaccine (T = 1) or placebo (T = 0). A safety study followed the participants for one year to determine the occurrence of adverse events (Y = 1) or not (Y = 0). Unfortunately, as is common for studies with a long follow-up period, several participants dropped out of the study early, so that their value for Y was missing. Let O = 1 indicate that Y was observed. Suppose participants are randomized to placebo and participants experiencing adverse events tended to drop out of the study early. Suppose also that, unknown to the investigators, the vaccine did not cause adverse events.
(a) Draw the causal DAG for these variables.
(b) What type of bias is presented in this example?
(c) Explain why assessing the safety of the vaccine by estimating the association between T and Y for those with O = 1 is a biased analysis.
