关键词 > SESA2022/SESS2022
SESA2022/SESS2022 Aerodynamics/Hydrodynamics 2022-2023
发布时间:2024-01-26
Hello, dear friend, you can consult us at any time if you have any questions, add WeChat: daixieit
SESA2022/SESS2022
FINAL ASSESSMENT 2022-2023
TITLE: Aerodynamics/Hydrodynamics
DURATION: 8 hours (including scanning/upload time)
There are two parts (Part A and B) to this assess- ment. Answer ALL questions in both parts.
Part A - 50%
This part contains 2 questions with each question con- tributing 25% to the total mark. The final scanned (and/or exported) PDF should be uploaded as a Turnitin submission for Part A.
Part A also requires the use of .csv file based on the student number as mentioned in the question.
Part B - 50%
This part contains 2 questions with each question con- tributing 25% to the total mark. The final scanned (and/or exported) PDF should be uploaded as a Turnitin submission for Part B.
For both parts, carry out step-by-step analytic work that is required on paper (only hand-written solution is ac- ceptable - this can be hand-written on a digital de- vice). Clearly write down the equations that you used and provide citations to the appropriate topic notes (with Topic name/number and PPT slide number). All steps leading up to the numerical evaluation should be clearly shown in the hand-written solution. You can use www. wolframalpha.com for algebra and calculus. You must present screenshots of your input and the output taken from the site. Numerical calculations and plotting should be carried out using Python or other program- ming tools with appropriate evidence (i.e. screenshots of your code with commentary as typically shown during your lectures). If you used parts of a code provided as lecture/tutorial material, then please reference the ap- propriate source.
ALL NECESSARY INFORMATION TO COMPLETE THIS ASSESSMENT ARE AVAILABLE IN THE COURSE MATERIAL AND/OR IN THIS QUESTION PAPER. DO NOT CONSULT THE INTERNET OR
EACH OTHER TO CARRY OUT THIS ASSESSMENT.
Part A
Q1.
Wind tunnel velocity measurements are taken through a boundary layer on a flat plate where the boundary layer is tripped at the leading-edge using a roughness strip; therefore, the flow will be turbulent right from the leading edge. The y position (in mm) and measured average velocity U (in m/s) are given in a .csv file.
Students with ID number ending in 0, 2, 4, 6, 8 : The data is given in file1.csv
Students with ID number ending in 1, 3, 5, 7, 9: The data is given in file2.csv
The fluid density and kinematic viscosity are measured to be ρ = 1.225kg/m3 , = 1.5 10-5m2 /s.
(i) Find the freestream velocity (U1) in m/sand estimate the boundary layer thickness, δ in mm, which is defined as the wall-normal position where U = 0.99U1 . You should use linear interpolation if you cannot directly de- termine the position from the data. Both values should be evaluated to 3 decimal places. (3 marks)
(ii) Find the displacement (δ*) and momentum (θ) thick- nesses of the boundary layer in units of mm to 3 decimal places (4 marks)
(iii) The velocity profile follows a self-similar power law form,
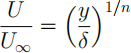 (1)
(1)
Here, δ will change along the streamwise direction with the growth of the boundary layer. If you know the value of δ at a given location, then, you can describe the entire velocity profile at that location using the above equation (and the given dataset). Find the value of n that best fits the data provided. Plot the data as well as the best fit profile (5 marks)
(iv) Experimental limitation meant that it was not pos- sibleto measure the velocity profile at the trailing edge of the flat plate. Yet, it was possible to estimate the boundary layer thickness at the trailing edge (δTE ).
Students with their ID number ending in 0, 2, 4, 6, 8 who used file1.csv: δTE = 35 mm
Students with their ID number ending in 1, 3, 5, 7, 9 who used file2.csv: δTE = 30 mm
Given this information and the fact that the velocity pro- file is self-similar, estimate the value of skin-friction drag of the entire plate in newtons to 3 decimal places (as- sume that the boundary layer on both sides of the plate are identical) (5 marks)
(v) The roughness strip at the leading-edge was re- moved and measurements were taken at a different streamwise location. In this case, the flow is expected to transition from laminar to turbulent at some point along the plate. If the measured profile at this new location is the same as the one in the .csv file, determine the distance from the leading-edge of the flat plate to this measurement location in meters to 3 decimal places. (8 marks)
Assume that the transition Reynolds number is 750,000 and the following relationships for the momentum thick- ness for laminar and turbulent boundary layers:
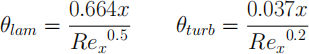
where Rex = U∞x/v and x is the distance from the leading-edge of the flat plate.
Students with their ID number ending in 0, 2, 4, 6, 8 use file1.csv for the data
Students with their ID number ending in 1, 3, 5, 7, 9 use file2.csv for the data
Q2.
In 2D potential flow, a fan can be modelled with a doublet located at the axis of the fan. This fan is now placed near a vertical wall where it sucks the fluid in front of it and pushes the fluid towards the wall as shown in the figure.
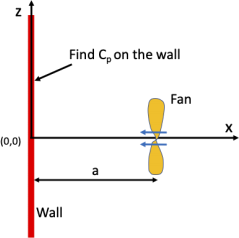
(i) Write the stream function that will represent this flow in terms of the doublet strength κ and spacing a of the fan relative to the wall (z-axis). Discuss the different ingredi- ents of the streamfunction and their roles. Plot the flow field (streamlines and velocity vectors) by using the rel- evant parts of the potential flow code that is provided in your lecture materials. Indicate how the plot verifies (or not) that you have the correct streamfunction that satis- fies the important boundary conditions. (8 marks)
Students with their ID number ending in 0, 2, 4, 6, 8: Use κ = 4π m3 /sand a = 1m.
Students with their ID number ending in 1, 3, 5, 7, 9: Use κ = 2π m3 /sand a = 0.5m.
(ii) Derive an expression for the pressure coefficient (Cp) along the vertical wall, where,
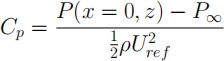
This expression should only depend on ratio z/awhere z is the vertical location along the wall and a is the horizon- tal distance between the wall and the doublet. Assume that the static pressure is P1 at a location where the ref- erence velocity Uref = κ/(2πa2 ) m/s. (10 marks)
(iii) Plot the vertical component of velocity (w) and pres- sure coefficient (Cp) along the wall (i.e., x = 0 for all z) for κ and a values given below. Compare w and Cp from your potential flow code to the analytically derived val- ues (make two separate plots, one for the w velocity and another for Cp). Discuss the reasons for any observed similarities/differences between theory and computation. (7 marks)
Students with their ID number ending in 0, 2, 4, 6, 8: Use κ = 4π m3 /sand a = 1m.
Students with their ID number ending in 1, 3, 5, 7, 9: Use κ = 2π m3 /sand a = 0.5m.
Part B
(All numerical answers in this Part should be rounded to 4 decimal places)
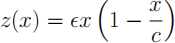
Q1. The shape of the camberline of a standard aerofoil is defined by
 (2)
(2)
where z is the camberline, c is the chord length, E is a small constant and x is the distance along the chordline with x = 0 at the leading-edge and x = c at the trailing edge.
(i) Calculate the zero-lift angle of attack (5 marks)
(ii) Calculate the moment coefficient about the quarter- chord point of the airfoil (5 marks)
(iii) Determine the expression for the distribution of cir- culation per unit length ( ) over the airfoil. (5 marks)
(iv) Plot the dimensionless pressure difference, ΔCp , be- tween the upper and lower surface of a thin airfoil along the chord (c) at a geometric angle of attack α (8 marks)
(v) In a real airfoil, what happens to the flow near the leading edge when the pressure difference is very high? (max. 10 words) (2 marks)
Students with ID number ending in 0, 2, 4, 6, 8: Use α = 2。, E = 0.1 and c = 5m.
Students with ID number ending in 1,3, 5, 7, 9: Use α = 5。, E = 0.2 and c = 10m.
Q2. An aircraft engine requires power P while flying steadily at speed of U1 . The aircraft wing has a sym- metric airfoil section and a rectangular planform with elliptic lift distribution. The wing span is band chord is c. The airfoil section is constant through the span. The lift coefficient of the wing is CL . The density of the fluid as 1.225kg/m3 .
(i) Find the local geometric angle of attack at the centre of the wing in degrees. (9 marks)
(ii) Find the ratio of induced drag to total drag.(5 marks)
(iii) Name one way to reduce the induced drag for a given payload and wing area. (max. 10 words) (1 marks)
(iv) If geometric twist in the wing was not an option, can you still obtain an elliptic lift distribution? Justify. (max. 20 words) (2 marks)
(v) Assuming the same elliptic distribution, find the rep- resentative angle of attack for the induced lift slope factor given below (3 marks)
Students with ID numbers ending in 0, 2, 4, 6, 8:
Use P = 300 kW, U1 = 75 m/s, b= 10m, c = 3m, CL = 0.35 and Slope factor=0.1
Students with ID numbers ending in 1, 3, 5, 7, 9:
Use P = 200 kW, U1 = 60 m/s, b= 8m, c = 4m, CL = 0.4 and Slope factor=0.2
