关键词 > Excel代写
Portfolio Recommendation and Analysis
发布时间:2024-01-18
Hello, dear friend, you can consult us at any time if you have any questions, add WeChat: daixieit
Portfolio Recommendation and Analysis
Course Name: Fixed Income Security
1. Executive Summary
Following the investigation of three different notes, the portfolio of 5-year and 10-year treasury notes is the best option, according to the analysis of minimum variance portfolios and sharpe ratio. This portfolio performs the best during because it has the highest sharpe ratio of the three investment portfolios, suggesting that this portfolio carries the lowest risk possible given the rate of predicted return. The optimal bond portfolio will thus consist of 10% of 5-year treasury notes and 90% of 10-year treasury notes.
2. Introduction
This article first analyzes the 1-year, 5-year, and 10-year Chinese Treasury Notes’ yield curve during December 4, 2010 to December 3, 2022, which gives us a general understanding of Chinese economic environment. Then the yield curves of three bonds from November 4, 2022 to December 8, 2022 are analyzed, and their maturities are 3 years, 5 years, and 10 years respectively. Next, combine these bonds in pairs, and construct the Return vs Risk diagrams of the three portfolios respectively, and select the portfolios with the minimum variance that is the portfolio of 5YB and 10YB. At the same time, three combined test models are constructed to verify the accuracy of the basic model, and the best result is still a combination of 5 and 10 years portfolio. Based on the above conclusions, 5YB and 10 YB portfolio is selected as the optimal portfolio.
3. Methodology
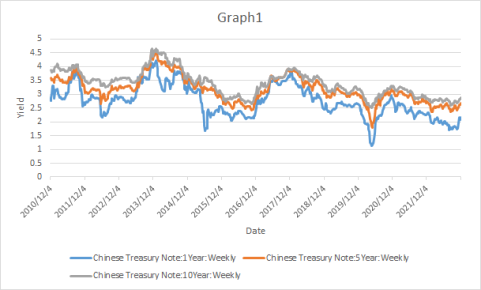
In the first step, the 1-year, 5-year, and 10-year weekly data of Chinese treasury bills from December 4, 2010 to December 3, 2022 is used, and the ‘date’ and ‘date to maturity’ are used as the abscissa respectively. ‘Yield to maturity are plotted as ordinates. This step is purposed to observe Chinese economic environment from December 4, 2010 to December 3, 2022.
The next step is to build the model. In the process, the 3-year (from May 27, 2022 to December 8, 2022), 5-year (from October 30, 2020 to December 8, 2022), and 10-year (from July 24, 2015 to December 8, 2022) weekly data of Chinese treasury bonds are used. Combine the formula:
Return=ln(Pt/Pt-1)*100%
To calculate the weekly return of each bond and convert into year return. Then use the data from October 28, 2022 to December 8, 2022 as the test data, and other data as the training data. Calculate the mean and standard deviation of the training data and test data, respectively. According to Markowitz's portfolio theory, two pairs of three bonds are combined to construct three different portfolio models. Plot the Return vs Risk for the three portfolios with different weights as follows steps:
Two risky security portfolio’s variance is:
 (E1)
(E1)
differentiate the  and wD then set the derivative equal to 0:
 (E2)
(E2)
Because WD+WE=1, so the variance can be written as:
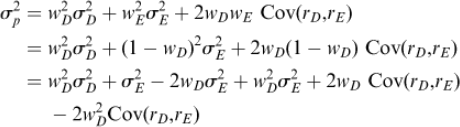
the first order conditions of equation (E2) can be written as:
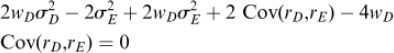
Finally, the equation can be written as:
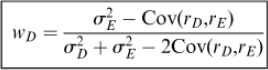
then identify the minimum variance portfolios (MVP), which is the least risky portfolio among a series of portfolio risks, suitable for risk-averse investors. Due to the equal relationship between risk and return, the return of this investment method is also the lowest. Then, use the test data to check whether the model is reliable, five- and ten-year combination performs best. Finally, using the Sharpe ratio as the standard, that is:
Sharpe Ratio=Return/Risk
the MVP of each combination is compared, and the MVP of the five-year and ten-year portfolio has the highest return per unit risk.
4. Analysis
4.1. Environment
It can be seen from Graph1 that the yields of the three Chinese Treasury Notes become lower over time, and the volatility of the yield of notes with a shorter term is greater than that with a longer term.
The term ’yield curve’ describes a graph's curve where the yield of fixed- interest securities is plotted against how long they have till maturity. Graph2 shows that the three curves are in an upward trend as the maturity date as a whole gradually advances.The increasing slope shows that investors expect to be compensated for the higher risk associated with making investments over a longer period of time.
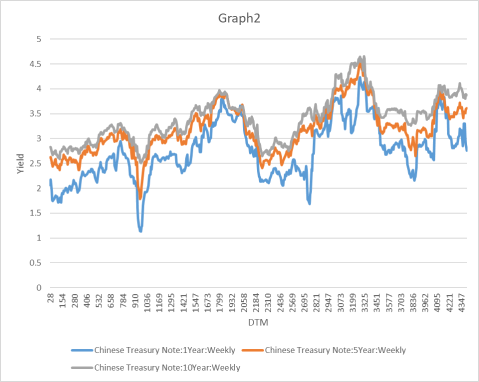
But these three different kinds of notes with maturities of roughly 938 and 3836 days, returns on all three types of stocks diminish significantly. Policy considerations or the state of the economy may have an impact on this viewed in terms of volatility.
The market often anticipates greater compensation for greater risk since longer-term bonds are vulnerable to greater risk, including increased vulnerability to future defaults and interest rate changes. As a result, this yield curve is seen as "normal" by the market.
The curves of the three time-period notes show that, in terms of volatility, the 3-year treasury note has the highest level, the 5-year treasury note also fluctuates significantly, and the 10-year note has the lowest volatility in comparison to the other two notes. Short-term bonds can be explained by the fact that they have shorter maturities and a shorter duration, making them more susceptible to market tightness (or the supply and demand of funds).
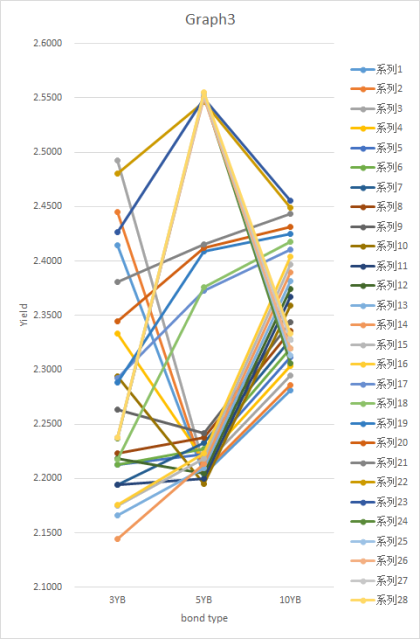
Graph 3 nicely captures the volatility of yields: Three-year Treasury yields are the most volatile and spread between 2.1% and 2.5%;The 10-year volatility is the smallest and is evenly distributed between 2.27% and 2.47%. The volatility of five year treasury bonds is less than that of 3 year bonds, and is concentrated at 2.14~2.2% and 2.53~2.56%, with a small amount distributed at 2.36~2.43%.
In graph 4, the 3-year Treasury note first experiences a huge fall before fluctuating significantly as the maturity date gets closer. Instead, as maturity lengthens, the price of 5-year Treasury notes rises. However, the yield rate on 5-year and 10-year treasury notes fell significantly at maturity of 548 days, while the yield on 5-year treasury notes remained practically unchanged.
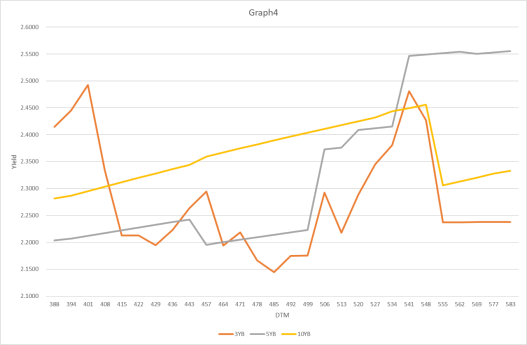
The overall shape of the yield curve depends on current economic conditions and investor confidence in the future. According to the information given in the graphs, the current economic environment is in a state of good inflation, and the expected interest rate is still rising.
4.2. Portfolio
4.2.1. Minimum Variance Portfolio
The mean and standard deviation (risk) of the returns is needed to construct Return vs Risk graph during the period of changing weight.
Table1 the mean and standard deviation of return
|
|
3YB vs 5YB |
3YB vs 10YB |
5YB vs 10YB |
|
Mean |
0.166850 |
1.05758 |
0.304915 |
|
SD |
-9.726620 |
10.59976 |
36.109145 |
Then from the Return vs Risk graphs of 3 portfolio as follow graphs:
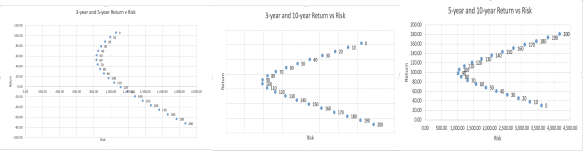
The minimum variance portfolio for 3-year and 5-year treasury notes consists of 60% of 3-year notes and 40% of 5-year notes, which has the lowest Return/SD ratio and the lowest risk for the rate of projected return. When compared to the modeling era, the Return/SD ratio for this portfolio with a W1 of 60% declines by -6.62% during the test period.
Table2 weight, the portfolio Standard Deviation (SD), mean and Return/SD of MVP
|
|
3YB vs 5YB |
3YB vs 10YB |
5YB vs 10YB |
|
weight |
60 |
100 |
90 |
|
SD |
830.3209692 |
972.662011 |
1022.073 |
|
mean |
52.31412926 |
16.68505 |
98.23112 |
|
Return/Risk |
0.063005 |
0.017154 |
0.09611 |
The lowest variance portfolio for 3-year and 10-year Treasury notes consists entirely of 3-year notes and not at all of 5-year notes. Throughout the testing period, the Return/SD ratio of this portfolio, which is entirely made up of 3-year notes, decreased by -24.42 percent.
And The minimal variance portfolio for 5-year and 10-year Treasury notes is 10% of 5-year notes and 90% of 10-year notes. This portfolio raises the Return/SD ratio during the testing period from 0.1 to 2.53.
As a result, the minimum variance portfolio of 3-year and 5-year treasury notes and 3-year and 10-year treasury notes performs poorly during the test period, whereas the minimum variance portfolio of 5-year and 10-year treasury notes performs better than the modeling period, which is evident from the increase in Return/SD ratio.
4.2.2. Best Performing Portfolio
Compared to the modelling period, the best performing portfolios of 3-year and 5-year treasury note in the test period is W1 equals to 100%. Coincidentally, the best performing portfolios in 3-year and 10-year treasury note and 5-year and 10-year treasury note in the test period is also W1 equals to 100%.
Ho (1995) states that one of the most important determinants of portfolio performance is the covariance of bonds groups. The best-performing combinations are 5 and 10 years bonds portfolio. In the test model, the covariance of this group is only 0.00003136, while the corvariance of the 3-year and 5-year groups and the 3-year and 10-year groups are respectively -0.0134957 and 0.0122918. It can be seen that the absolute values of the covariance of these two groups is much larger than the five-year and ten-year groups, which may be the reason of the difference in performance.
Table3 of best performing portfolio
|
|
3YB vs 5YB |
3YB vs 10YB |
5YB vs 10YB |
|
weight |
0 |
0 |
0 |
|
SD |
1.024287 |
0.56264 |
0.56264 |
|
mean |
2.530391 |
1.348327 |
1.348327 |
|
Return/Risk |
2.470393 |
2.39643 |
2.39643 |
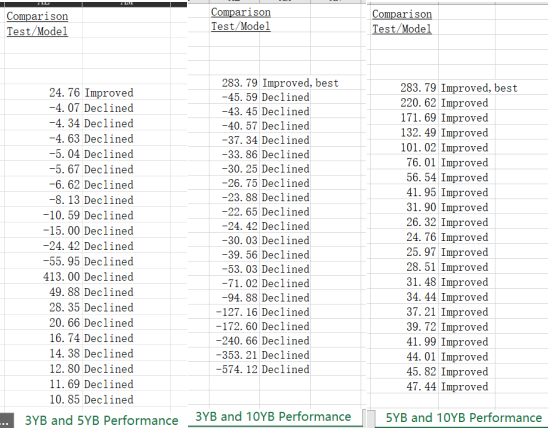
In the performance comparison, as the following graphs show, it was surprisingly found that the performance of the five-year and ten-year combination is much better than the other two combinations, which just confirmed the previous conjecture. From this, it can be concluded that the reason why the five-year and ten-year groups perform better is because the five-year and ten-year correlations are lower in the test data.
4.2.3. Strategy: Beyond the test period
Assume:
l All investors are price takers, mean-variance optimiser, and have identical information and holding periods.
l All assets are marketable and divisible.
l The market portfolio includes all risky assets
l There is a single risk-free rate at which one can borrow or lend any amount.
l No market imperfections (no taxes, short selling restriction, transaction costs, etc)
Use the existing data to construct the CAPM model, and still use the original test data to test the fit of the model. Use the existing data to construct the CAPM model, and still use the original test data to test the fit of the model. If the model fits well, it can be used to predict returns beyond the test period. After predicting the future rate of return, still use the previous model based on Markowitz's investment theory to select the best Return/Standard Deviation ratio.
5. Conclusion
l The 3-year and 5-year treasury note portfolios that performed the best in the test period relative to the modeling period were W1 equal to 100%. Interestingly, W1 equals 100% for the highest performing portfolios in the test period for 3-year and 10-year Treasury Notes as well as 5-year and 10-year Treasury Notes.
l The 5-year and 10-year treasury note portfolios outperform the other two MVP portfolios, per the analysis above, for two main reasons. First, they have the highest sharpe ratio among the three investment portfolios, indicating that they carry the lowest risk possible given the rate of expected return.
l While the other two groups perform badly over the test period, the 5-year and 10-year treasury note portfolios do the best. Their sharpe ratio improved by 283.79%.
Indeed, based on the prior study, it can be said that long-term bonds take lower risks and better returns because they typically have higher returns and lower volatility than short-term bonds. The optimum option should be a portfolio of 5- and 10-year Treasury notes from this perspective.
6. Recommendation
l It is advised that the current state of the economy and the anticipated interest rate are taken into account while building a bond portfolio. Several economic variables will affect the type of bond and portfolio weight.
l Bonds with longer maturities typically have better rates of return and lower levels of volatility. Long-Term Bonds Should Be Included in Your Portfolio.
l The correlation of assets in the portfolio will affect the performance of the portfolio. When building a portfolio, try to choose assets with low covariance.
Reference List
Bodie, Z., Kane, A. & Marcus, A.J. 2021, Investment, 12th edition, McGraw-Hill Education, New York.
Ho, T.S., Stapleton, R.C. and Subrahmanyam, M.G. 1995, ‘Correlation risk, cross-market derivative products and portfolio performance’, European Financial Management, no. 1 pp. 105-124.
Lee, CF., 2006, Encyclopedia of Finance, Springer, Boston, <https://doi.org/ 10.1007/978-0-387-26336-6_81>.
