关键词 > ECE584/OE584/BE541
ECE584/OE584/BE541 Medical Imaging Systems Homework 2B
发布时间:2024-01-05
Hello, dear friend, you can consult us at any time if you have any questions, add WeChat: daixieit
ECE584/OE584/BE541 Medical Imaging Systems
Homework 2B
Computed Tomography
Resources: Chapter 10 Computed Tomography
Due Date: Tuesday Week 5
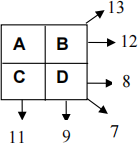
1) A four pixel object is shown (right), with unknown attenuation coefficients A, B, C and D. Six projection measurements through the 2 by 2 array are given.
a) Using algebra, determine A, B, C and D by solving multiple equations for the multiple unknowns. For example, one equation would be A+B = 12.
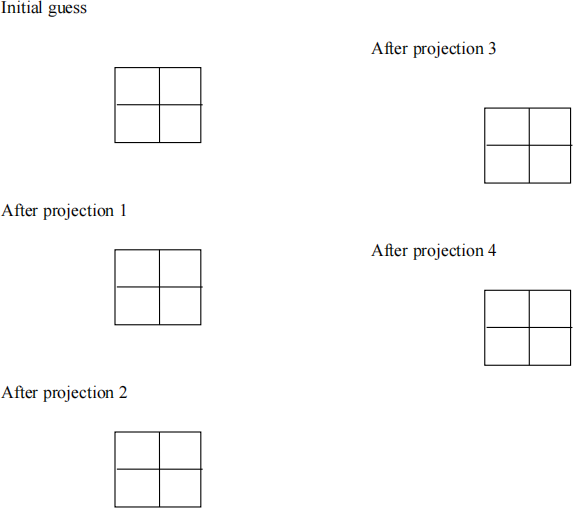
b) Now solve for A,B,C,D using the iterative technique described in lecture. Let your initial guess be zeros for all four unknowns.
This worksheet might help
2) Download the file CircleSinogram.mat from Moodle and load it into Matlab. The array projections contains 60 projections of a 20 x 20 pixel image. The projection angles range from 0 to 177 degrees in 3 degree increments. Therefore, the first column of projections contains the 20 pixel projection of the image rotated by 0 degrees. The second column of projections contains the 20 pixel projection of the image rotated by three degrees. In this question you will reconstruct the unknown image through iterative reconstruction using the following steps described in pseudo-code.
• Initialize the reconstructed image as a 20 x 20 array of zeros.
• For each iteration
For each of the 60 rotation angles
- Rotate the image matrix using the imrotate command:
imrotate(image_matrix, phi, 'bicubic','crop');
where image_matrix is the matrix containing your image, and phi is the rotation angle
- Calculate the 1D projection through your image by summing the columns of the rotated image matrix
- Calculate the difference between the calculated projection and the corresponding projection form the projections array.
- Distribute the difference for each image row equally across the columns of your rotated image matrix.
- Rotate the image matrix back to zero using:
imrotate(image_matrix, -phi, 'bicubic','crop')
- This image matrix is now your initial guess for the next iteration.
• Iterate until the mean absolute different between the image matrix of successive iterations is less than 0.01.
Mean absolute difference = mean(mean(abs(image_matrix_old – image_matrix_current)))
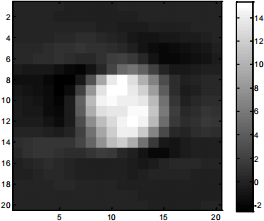
Please hand in a print out of the reconstructed image and your code. If done correctly the image_matrix_current will look like the following;
imagesc(image_matrix_current);
colormap gray;
colorbar;
axis image;
3) Now use the program that you made to reconstruct the sinogram of a mystery dataset. Download the Matlab datafile called MysterySinogram.mat. If you wrote your code well, you should have very few modifications to make. The mystery sinogram contains 200 projected views of a 512 x 512 pixel image. So the sinogram contains 200 views covering 180 degrees (not nearly enough views for good angular sampling. but good enough for a homework problem). Each view contains 512 detectors representing a single parallel-beam projection. You should reconstruct a 512x512 pixel image (a standard image size). Since this is a much bigger problem, I recommend that you cut-off the iterations at 10 or so. It will take too long to get down to the same level of accuracy as problem 2. Hand in your image – you be able should recognize the image. Hint: it’s human.
4) Now we’ll be working with a faster reconstruction algorithm, called Filtered Back-Projection FBP). Generate an image of a standard mathematical phantom of the head using the matlab function phantom, with an array size of 256x256. Use the radon function to generate the sinogram image of the Shepp-Logan phantom with 360 views. Then use the matlab function iradon to perform filtered back-projection on the sinogram and produce the reconstructed image. (you will need the image processing toolbox from Matlab to use the these functions https://www.mathworks.com/products/image.html )
Submit plots with proper labels for the following:
a.) The Shepp-Logan phantom image
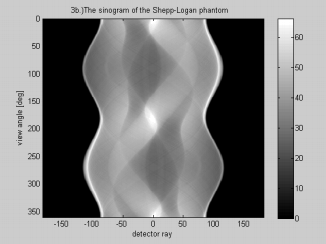
b.) The sinogram of the Shepp-Logan phantom with detector ray plotted along the x-axis and view angle plotted on the y-axis
c.) The reconstructed Shepp-Logan phantom image.
You should adjust the grayscale limits so that you can see the fine detail in the image that you create and put appropriate labels on your plot. The matlab functions imagesc and colorbar will be useful for creating these images.
For example:
5) Using the Matlab functions described above for performing FBP and displaying images, you will investigate some effects of image artifacts.
a. Use the Shepp-Logan phantom (256x256) to simulate a bad detector by adjusting the value of one detector for all the view angles in the sinogram dataset and then reconstruct the modified sinogram. Plot the image and notice on how the effect manifests in the image. Compare the following cases and discuss the parameters that effect the image artifact known as ‘ring artifact’. Plot the images on the same window and level to make comparisons.
i. Set channel number 100 to zero and plot the image (near the far edge)
ii. Set channel number 120 to zero and plot the image (edge)
iii. Set channel number 180 to zero and plot the image (center)
iv. In the next test perturb all three channels (100, 120, and 180) but this time only perturb the channels value by 5%. That is set the value to 1.05 times its initial value. You may have to adjust the window level to see the effect better.
b. Analyze and discuss the results of your investigations. The artifacts should be worse if there is a bad channel near the isocenter. Can you specify how good a detector channel has to be to avoid artifacts?
6) Using the Matlab functions described above, you will investigate some effects of filtering on image reconstruction.
a. Generate an image of a head phantom using the matlab function phantom, with an array size of 512x512. Use the radon function to generate the sinogram image of the Shepp-Logan phantom with 360 views. Add some noise to the sinogram using the poisson statistics (the matlab function imnoise works well here, but you will have to scale the data). Use iradon to reconstruct the image. Compare the following cases and discuss the effect the filter type on resolution and noise in the image.
i. Reconstruct the noise-free projections
ii. Reconstruct the noisy projections using no filter
iii. Reconstruct the noisy projections using the 'Ram-Lak' filter (otherwise known as a ramp filter)
iv. Reconstruct the noisy projections using the 'Hamming' filter (in order to see the slight differences between the ramp filter and the Hamming filter you should display the image on the same window and level)
b. Analyze and discuss your results. Which filter would you choose for high resolution objects like lung nodules? Which filter would you choose for low contrast objects like brain imaging?
