关键词 > MTH6134/MTH6134P
MTH6134 / MTH6134P: Statistical Modelling II Main Examination period 2018
发布时间:2024-01-03
Hello, dear friend, you can consult us at any time if you have any questions, add WeChat: daixieit
Main Examination period 2018
MTH6134 / MTH6134P: Statistical Modelling II
Question 1. [27 marks] A fast food franchise is test marketing three new menu items. To find out if they have the same popularity, 18 franchisee restaurants are randomly chosen for participation in the study. Six of the restaurants are randomly chosen to test market each of the new menu items. Below are the sales figures, in number of orders per day, of the three new menu items in these restaurants after a week of test marketing.
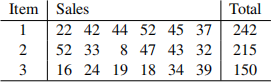
The sum of squares of the observations is 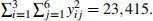
(a) Write down a suitable model for these data and any necessary assumptions, explaining your notation. [5]
(b) Compute the analysis of variance table and test factor item. [10]
(c) Using an appropriate constraint, write down in matrix form the multiple regression model that is equivalent to the analysis of variance model for the data. [6]
(d) By using the model in part (c), find the least squares estimates of the parameters. [6]
Question 2. [22 marks] An engineer conducted a randomised block experiment to compare three metals, nickel, iron and copper, for bonding agents for an alloy material. Components of the alloy were bonded using the metals and the pressures required, in pascals, to break the bonds were measured. Seven ingots of the alloy material were available for the experiment and the engineer recognised the possibility of variability between the ingots. Thus, the engineer constructed bonds of components from each ingot using each metal. The data are given below.
An analysis of variance was performed using GenStat and the output is as follows:
Analysis of variance
Variate: pressure
Source of variation d.f . s.s . m.s . v.r . F pr .
metal 2 131.90 65.95 6.36 0.013
ingot 6 268.29 44.71 4.31 0.015
Residual 12 124.46 10.37
Total 20 524.65
(a) Briefly explain how you would enter these data into GenStat. What expression should be entered in Treatment Structure in the analysis of variance Dialogue Box? [4]
(b) Draw conclusions from the above output. [4]
(c) Use the least significant difference method to compare pairs of metal means. [9]
(d) Analyse the data ignoring the block structure to test factor metal. [5]
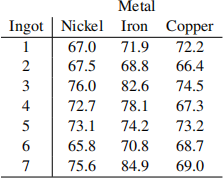
Question 3. [18 marks] A factorial experiment was designed for making microwave popcorn. The effect of time of cooking, in minutes, and microwave power setting, as a percentage of the total available, each at two levels, was studied, and the response variable was the amount of inedible “bullets” or unpopped kernels. Below are the results of two replicates of the experiment.
The model to be used for these data is

for i = 1; 2, j = 1; 2 and k = 1; 2, where αi is the effect of the ith time, βj is the effect of the jth power, and γij is the effect of interaction between the ith time and the jth power. The constraints on the parameters are Σ![]() 1αi = 0, Σj(2)= 1 βj = 0, Σ
1αi = 0, Σj(2)= 1 βj = 0, Σ![]() 1γij = 0 and Σj(2)= 1γij = 0, and it is assumed that εijk ~ N(0; σ2 ), all independent.
1γij = 0 and Σj(2)= 1γij = 0, and it is assumed that εijk ~ N(0; σ2 ), all independent.
(a) Derive expressions for the least squares estimates of µ, αi , βj and γi j. [10]
(b) Derive expressions for the fitted values and residuals. [3]
(c) Write down contrasts for testing for the main effects of time and power. Construct another contrast which is orthogonal to these. What is this contrast testing? [5]
Question 4. [21 marks] A company is interested in testing the uniformity of its film-coated pain tablets. Three batches were randomly sampled from each of its two blending sites and five tablets were assayed from each batch. Below are the responses, in micrometres.
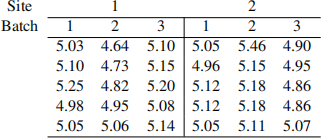
The sum of squares of the observations is 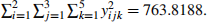
(a) Write down a suitable model for these data and any necessary assumptions, explaining your notation. [5]
(b) Compute the analysis of variance table, and test factors site and batch. [13]
(c) Estimate the variance components. [3]
Question 5. [12 marks] Consider a completely randomised design with four treatments. Let the data vector be y = (y11 ;y12 ;y21 ;y22 ;y31 ;y32 ;y41 ;y42)T.
(a) Define the treatment subspace VT . [4]
(b) Compute the projections PVT y and PVT⊥y. [4]
(c) In the usual analysis of variance terminology, what are the names of the projections that you computed in part (b)? [2]
(d) Define the sum of squares and the degrees of freedom for VT⊥. [2]
