关键词 > Excel代写
NYC Assignment #5
发布时间:2023-12-21
Hello, dear friend, you can consult us at any time if you have any questions, add WeChat: daixieit
(Pablo):
To solve this problem I have applied an optimization problem in excel. This is based on maximizing the Net Present Value of 2022 calculated with the expected profits in 2002-2025, calculated in turn with the forecasts made in the previous assignment and with a set of specified expenses. For this, I have set up three main tables that I will explain below:
Revenue table:
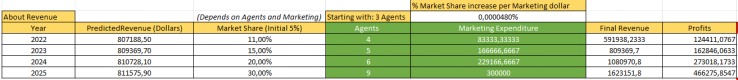
Explanation of the columns:
- Year: The year of the information on the table.
- Predicted Revenue: The revenue in dollars forecasted in Assignment 4 with a time series method based on the expected revenue of a competitor.
- Market Share: The percentage of market share I know the company will have in each year. This variable is calculated from the following two variables:
a. Agents: The number of real estate agents in the company. As you can read above this cell I have established a minimum of 3 agents necessary for the business to function. After these 3, each new agent increases the market share by 2%.
b. Marketing Expenditure: The expenditure in marketing in dollars by the company. As stated in the statement, for every 25,000 spent on marketing, the company's market share increases by 1.2%. To make the proper calculations, above this column I have specified how much market share the business increases for every dollar spent on marketing.
- Final Revenue: The final expected revenue of each year.
- Final Profit: The final expected profit of each year, calculated by subtracting the costs (next table) to the final revenue. This will be used to calculate the NPV which is the objective function of the problem
In the optimization problem, both “Agents” and “Marketing Expenditure” are the changing variables, that is why they are green colored. Those results are the ones after applying solver. Therefore, we can already see the agents and the marketing expenditure needed in each year to get the desired Market Share each year. (11%, 15%, 20%, 30%).
Costs table:
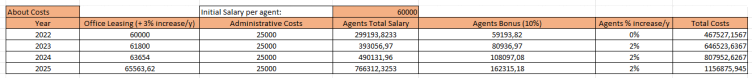
Explanation of the columns:
- Year: The year of the information in the table
- Office Leasing: The annual cost in dollars of leasing the office. After doing some research of the market I have established an initial leasing cost of 60,000$ and incrementing each year by a + 3%.
- Administrative Costs: The office costs but excluding the marketing, leasing and agent costs. I have estimated 25,000$ administrative Costs per year.
- Agents Total Salary: The total cost from the agent's salary. After doing research i have estimated a salary for each of 60,000$ per year.
a. Agents Bonus: Increase salary bonus for agents based on a 10% of the revenue from sales.
b. Agents % increase: The percentage increase of an agent´s salary. I have estimated a 2% per year increase.
- Total Costs: The sum in dollars of the total costs from this table + also the Marketing costs from the first table.
From this entire table we will finally take into account the "Final Costs" column since it is used to calculate the expected profit per year and therefore the Net Present Value which we will want to maximize with solver.
Condition tables
Agents
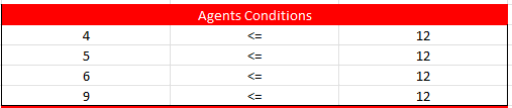
As indicated in the assignment statement, a maximum number of agents must be set so that solver has a limit. I have established a total maximum of 12 agents each year.
Market Share
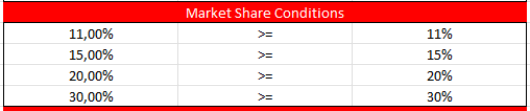
Now, we must establish the conditions in relation to the market share we want the company to obtain each year. As the statement sayst, the company adopts an aggressive position and therefore we apply as a condition for each year a minimum market share to be obtained.
Marketing Expenditure
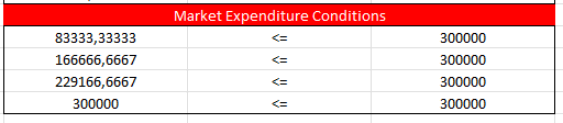
The last table is about the conditions of the budget spent on marketing. This was not in the statement of the assignment, but it is something necessary that I had to add. If I did not add a cap on marketing spend solver gives very unrealistic results, for example raising without any limit on marketing spend and without raising the number of agents. In my case I have set a maximum of $300,000 to spend on marketing.
All these three condition tables are the constraints of the optimization problem, which are set individually in the solver tab.
Objective Function:
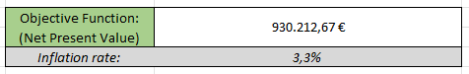
The objective function is the Net Present Value in 2022 calculated with the estimated profits of each year. In addition, I have established an inflation rate of 3.3% which I have estimated by doing research on the subject.
Results of the Optimization Problem:
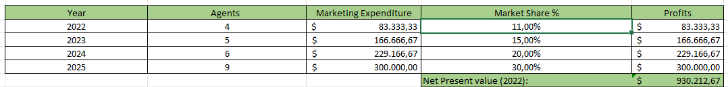
After performing all the processes just explained and having applied solver with the objective function, the variables to change and the conditions, we obtain the results of the problem shown in the table above. We now know the number of agents and the marketing expenditure to be made each year to obtain the desired market share percentages. We can also see the NPV we have.
(Samhita):
The problem at hand asks us to use optimization methods through Excel’s solver in order to find the number of agents to hire for our firm, create a marketing budget, and maximize the net present value. Utilizing the projected revenue model created in R studio in NYC assignment #4, the revenue for years 2022-2025 was integral to further calculations.
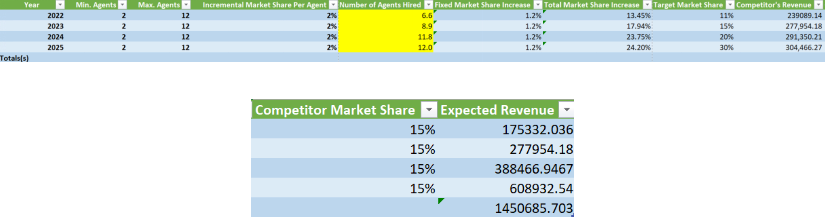
The first step in using the solver’s capabilities is to create data frame tables that explicitly lay out the information that has been established by the assignment scope as well as including calculated fields under certain assumptions we have made about Bushwick in the past. For example, the minimum and maximum number of agents are floors and limits set by me in order to offer constraints to the returned output. I decided on having an initial employee pool of 2 agents and a maximum bound of 12 considering each 1 agent raises the market share by 2% (shown in the incremental market share column). The number of agents hired column is what we set the changing variables to in the solver and use the maximization of NPV as the objective function. The competitor market share, fixed market share, and target market share values are given and the competitor's revenue is what we calculated in assignment #1.

Furthermore, the above table represents the costs that we must account for in the problem statement. I looked up available office spaces in Bushwick and it said the cost was $25 per square foot. I assumed a 1500-square-foot building and multiplied this by the 25 to get a yearly lease cost of $37,500. I also calculated the rent price for 2023-2025 by assuming a 3.5% yearly rent increase (Forbes). Furthermore, I researched the administrative costs and took the 1st quartile figures for Bushwick residences making the average annual cost roughly $70,000. Bonuses (as clarified by the assignment) are 10% of sales, therefore I took the expected revenue figures and multiplied them by 10%. The base salary I started with was $60,000 because that is competitive in Brooklyn and I decided to increase every year by 8.7% (Trading Economics).
The marketing costs are a little different because I calculated them using this general formula: =((11%-5%)/1.2%)*25000. I replaced the 11 percent with the respective target market percentage for each year to show the relationship between captured market share and marketing costs. The total costs are a summation of each row.
In terms of the NPV, we know the calculation is done by subtracting expected revenue from the expected costs. The sum of expected revenue is $1,450,685 and the sum of expected costs is $2,022,971. This is what gives me a negative NPV. All things considered, this isn’t necessarily a bad reflection on the firm because the housing market is suffering from high interest rates lately which could be why costs are offputting sales. Regardless, the NPV and inflation rate from my calculations are shown below:
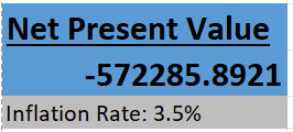
The NPV suggests that are the moment, despite solver's allocation of workers, marketing budget, and maximization of net present value as the objective function, the firm would still be in the hole when operating in Bushwick. It is important to keep in mind that my teammates and I all used different starting assumptions and strategies which greatly influenced our outcomes meaning this value is highly subject to variance.
Final Recommendation:
After looking at each group member’s analysis of the optimization problem we decided the final neighborhood recommendation to be
Sources:
DePietro, A. (n.d.). How Much Real Estate Brokers And Real Estate Agents Earn In Every State. Forbes. Retrieved November 26, 2023, from https://www.forbes.com/sites/andrewdepietro/2020/07/27/real-estate-broker-real-estate-agents-salary-state/
Estate Agent Salary in Brooklyn, New York | Salary.com
TRADING ECONOMICS. (n.d.-b). United States inflation rate. https://tradingeconomics.com/united-states/inflation-cpi#:~:text=US%20Inflation%20Rate%20Seen%20Slowing,a%20fall%20in%20gasoline%20prices.
874 Hancock St, Brooklyn, NY 11233 - Office/Retail for Lease | LoopNet. (2023, November 21). LoopNet. https://www.loopnet.com/Listing/874-Hancock-St-Brooklyn-NY/29276419/
1399 Myrtle Ave Mixed Use For Rent | PropertyShark
Your Guide to Calculating a Rent Increase Percentage - Zumper
