关键词 > 161.122
161.122 Statistics Assignment B Questions
发布时间:2021-09-28
Hello, dear friend, you can consult us at any time if you have any questions, add WeChat: daixieit
161.122 Statistics Assignment B Questions
Instructions
You need to complete this assignment using RStudio. You are expected to use R markdown wherever possible.
Please take note that some questions use different quantities for students so that you do the same work as your classmates, but that you get different answers to them because you have slightly different questions or slightly different data.
Once you have completed your work, you will need to upload both the Rmd and HTML files for your assignment to the class Stream site. A drop box will be used to receive the assignments. Please ensure you have fully submitted your assignment. Many students make the mistake of leaving their files in a draft form.
Individualised solutions files will be made available on Stream once the due date has passed.
1. A New Zealand manufacturer of aircraft components has a local factory as well as an off-shore factory. One particular type of component goes through very strenuous strength tests, and it is not unusual for a high proportion of individual components to fail the test.
The company’s quality engineer recently conducted a test on all of the components made in both factories last year. The results from the testing are as follows:
Of the 246 components tested that were made in New Zealand, only 194 passed the stren-uous test. Of the 203 components made off-shore that were tested, only 122 passed the same test.
(a) Construct the full table needed for calculating probabilities, including all row and col-umn totals.
(b) What is the probability that a randomly selected component is faulty and was made overseas?
(c) If a randomly selected component is found to be faulty, what is the probability it was made in New Zealand?
(d) If a randomly selected component is found to be from the New Zealand factory, what is the probability that it was faulty?
(e) If you could assume the probability that a component was faulty was independent of the probability that it was made in New Zealand, what would the probability be of a randomly selected component being a faulty component produced overseas?
(f) Justify why you believe the fault rate of parts is or is not independent of where they were manufactured.
This question is worth 7 marks.
2. If you put an ordinary incandescent bulb into a light fixture designed for a high efficiency (low heat) bulb, it is possible–but not certain–that the contact point will melt and the light bulb will become stuck in the socket. Extra labor is then required to remove it and clean the fixture’s contact point. An electrician estimates that these extra tasks must be performed 0.718 of the time when replacing an incorrect bulb. The electrician has been called to a house on another matter, and notices they have used the wrong light bulb type in four of their downlights.
(a) If the electrician points out the hazard and is employed to replace the bulbs, what distribution would best be used to model the number of bulbs that will be stuck in the socket? Explain your selection of distribution, including any assumptions made.
(b) If the electrician is working his way through a large apartment block, and each apart-ment has seven incorrect bulbs that must be replaced, what is the long run proportion of times at least five of the bulbs will be stuck and require the extra steps?
(c) What is the mean and variance of the distribution of the number of stuck bulbs?
This question is worth 11 marks.
3. Speed cameras cause grief for many of NZ’s drivers. A particular location near Massey catches eight speeding motorists per hour. This figure is an average of all hours between 9am and 3pm.
(a) Which distribution would best be used to model the amount of time between speeding motorists passing the speed camera?
(b) What proportion of speeding motorists will get their photo taken within 40 minutes of the previous speeding motorist?
(c) How many motorists would you expect to be caught speeding by the camera in any given three-hour period? And which distribution would best be used to model the number of speeding motorists in a three-hour period?
(d) What proportion of hours would you expect the camera to remain unused? That is, what is the probability that the camera takes no photos in an hour and that there are therefore no speeding motorists?
This question is worth 7 marks.
4. The lifetimes of two types of light bulbs are being compared by a company that must choose one of them for installation in their new office building. The number of hours that 17 light bulbs of each type last is given below:
SampleA=c(926.1, 934.77, 972.05, 956.46, 927.6, 970.2, 958.77, 964.64, 935.58, 933.08, 967.44, 941.33, 952.1, 936.95, 959.22, 941.31, 930.91)
SampleB=c(1956.88, 1956.59, 1922.35, 1930.44, 1938.72, 1923.21, 1946.75, 1955.49, 1944.13, 1938.43, 1961.67, 1929.96, 1955.06, 1940.05, 1927.48, 1935.61, 1921.55)
Note that the second type of bulb costs twice the price of the first.
(a) Choose your own graphs to compare the distributions of the two samples.
(b) Explain the differences in your own words and form a recommendation on the type of bulb the company should choose.
(c) Do the two types of light bulb have a similar distribution? That is, would the same model be appropriate, even if the parameters are different?
This question is worth 7 marks.
5. The quality of the production process for a new product is being intensively monitored. A quality index has been calculated for four samples from each of the first 37 batches of the new product. Your assignment template includes the command to get your personalised data needed to answer the following questions.
(a) Use R to plot
and s charts.
(b) Based on the above charts, decide if the process is in control with respect to the mean and variability. You must justify your answers.
(c) If the process is not in control, remove the doubtful batch(es) and replot the
(d) Plot
This question is worth 8 marks.
6. To monitor the manufacturing process of rubber support bearings used between the super-structure and foundation pads of nuclear power plants, a quality control engineer randomly sampled 90 bearings from the production line each day over a 15-day period. The bear-ings were inspected and the number of defects was found. The number of defects in your personalised data set are as follows:
2, 13, 3, 3, 4, 1, 2, 5, 4, 1, 11, 4, 3, 2, 3
(a) Use R to plot the appropriate control chart to check if the proportion of non-conforming units was in control.
(b) Assuming the assignable cause of variations have been found, construct a control chart that can be used to monitor the non-conforming proportion on future days of the process.
This question is worth 5 marks.
7. Two brands of digital scales that are purpose designed for measuring small weights are being evaluated for purchase by the university to replace old analog scales. The two brands both display weights to the nearest 1/100 of a gram and should not be used for weights of more than 150g. Only one brand will be purchased, and the purchase order will be for 150 sets of scales.
The lab staff have obtained 25 sets of scales from both manufacturers and have decided that there is no real reason why either brand should be preferred over the other in terms of their usefulness. Brand A is slightly cheaper than Brand B however so the decision is not a matter of randomly choosing among the brands.
On the advice of the senior lab technician, a benchmark weight of 50g and another of 100g are weighed on all sets of scales to test the consistency of each brand. She believed that these two weights were fairly representative of the weights that will need to be measured in the future.
Your data can be downloaded via Stream.
(a) Accuracy is a measure of biasedness and is calculated as the average of the sam-pled readings of an instrument minus the target reading that should have been seen. Contrast this with precision, which measures how consistent an instrument is in its readings. Precision is measured by the standard deviation of the readings. What is the accuracy and precision of each brand?
(b) Form a recommendation on which brand should be purchased.
This question is worth 8 marks.
8. A telescope contains 3 large mirrors. The time (in years) until a single mirror fails has been investigated by your colleagues. You now know that the probability that a mirror is still fully functional after t years is
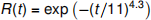
(a) All mirrors must be working to take the most detailed photographs. What is the proba-bility that the telescope can produce these types of pictures for at least 6 years?
(b) The lowest resolution photographs can be taken as long as at least one mirror is work-ing. What is the probability that these photographs can be taken for at least 6 years?
(c) The most common photographs the telescope will be taking are of medium resolution. This is possible as long as at least two mirrors are working. What is the probability that this remains possible for at least 6 years?
This question is worth 9 marks.
