关键词 > COMP4336/9336
COMP4336/9336 Mobile Data Networking Lab 9
发布时间:2023-11-11
Hello, dear friend, you can consult us at any time if you have any questions, add WeChat: daixieit
COMP4336/9336 Mobile Data Networking
Lab 9: Gesture Channel State Information
Objectives
• To observe impact of hand gestures on Wi-Fi CSI patterns
Prerequisites
• Access to a laptop
• Access to MATLAB (All UNSW students have free access to MATLAB)
Your Tasks
CSI extraction [1 mark]
In this set of experiments, two DAT files from different gestures will be given, legswing.dat and swipe.dat.
You are required to use MATLAB with the tools of Widar3.0, extract the Channel State Information(CSI). Please read the Widar 3.0 paper at:
http://tns.thss.tsinghua.edu.cn/widar3.0/data/MobiSys19_Widar3.0_paper.pdf
1. Install MATLAB R2021a and Signal Processing Toolbox ™ (UNSW provides free license to all students). Available from the following URL:
https://www.mathworks.com/help/releases/R2021a/signal/index.html
2. Download the gesture dat file and Widar 3.0 for MATLAB, follow the README file to setup your environment. Download link: https://bit.ly/3xY5NuO
3. Use the script dat 2 csi_mat.m to transform the DAT files into .mat files. Then you will be able to read it with MATLAB or Python.
Analyze differences for the gestures [3 marks]
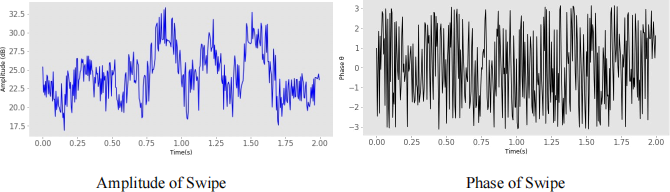
You are required to plot the graphs showing the raw CSI amplitude, phase against time/packet-index. Analyze the difference of amplitude, phase from the graphs you have plotted for different gestures.
Please observe how many subcarriers do we have in the CSI data, and select one to plot the amplitude and
phase graph. You can calculate and plot the amplitude as well as the phase with the python3 code fraction:
|
# /usr/bin/env python3 import h5py import matplotlib.pyplot as plt csi_workspace = h5py.File("pushpull_csi_.mat", 'r') # read the .mat file in task1 csi = csi_workspace['csi_trace'] # load & plot the amplitude of subcarrier 0 subcarrier = 0 amplitude = np.abs(csi['real'][subcarrier, :]+csi['imag'][subcarrier,:]*1j) # phase = np.angle(csi['real'][ subcarrier,:]+csi['imag'][ subcarrier,:]*1j) _, axs = plt.subplots(nrows=1, ncols=1, figsize=(11, 5)) ax_1 = axs.plot(amplitude.T) plt.show() |
Sample outputs:
What to submit?
1. Submit a ZIP file containing .MAT files for both gestures. [1 mark]
2. Submit a PDF report containing the following:
a. Plots of CSI Amplitude, Phases graphs [2 mark]
b. Your observations [1 mark]
Penalty at the rate of 5% for each day late will be strictly enforced for all lab submissions. All submissions will be subject to strict UNSW plagiarism rules.
End of Lab 9 – Hope you enjoyed this lab
