关键词 > Biophysics2A03/LifeSci2BP3
Biophysics 2A03/LifeSci 2BP3 Assignment 2 – Statistical Physics
发布时间:2023-10-28
Hello, dear friend, you can consult us at any time if you have any questions, add WeChat: daixieit
Biophysics 2A03/LifeSci 2BP3
Assignment 2 - Statistical Physics
Deadline: Tuesay, October 24th, 11:59 pm
Submission format: On Crowdmark, you may upload PDF, JPG, or PNG images of your report in the two sections. You should also provide a copy of your raw data in an Excel file (or similar:
Numbers, GoogleSheets).
Total Marks: 60 marks
Part 1: Self-avoiding Walk 30 marks - distribution indicated in assignment
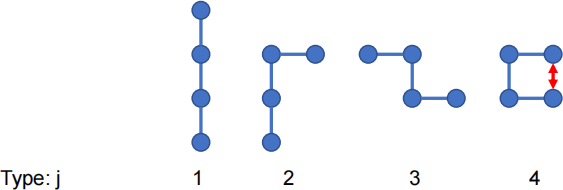
This part of the assignment uses the NetLogo program SAW3.nlogo. This uses a self-avoiding
walk of 3 steps (4 monomers) on asquare lattice in 2 dimensions. There are four types of
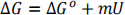
configurations possible, as shown below. There is an interaction between the first and last
monomers if they are on adjacent sites (as shown by the redarrow). We will call this a 'bond' - it could be a hydrogen bond, or any other kind of interaction. This bond has energy E when it is present. All the other configurations have energy 0.
The NetLogo program uses a Monte Carlo simulation to calculate the mean square end-to-end distance <R2>, and the mean number of bonds present <n bonds >. As there can only be either 0 or 1 bond, <nbonds > is equal to the probability that the molecule is in a type 4 configuration.
The program runs for 200 000 time steps. At each time step it moves either the first or the last monomer to a random position. There are three positions for the first and last monomers - left right and vertical. It then calculates the new energy and accepts or rejects the move using the Metropolis algorithm. The values of <R2> and <nbonds> are shown in the graph and in the boxes at the end of the simulation.
(a) Use the program to measure <R2> and <nbonds> as afunction of E/kBT for integer values of
E/kBT between -5 (attractive interaction) and 5 (repulsive interaction). Save these numbers in an Excel spreadsheet and plot graphs of the two quantities. Write a few sentences to explain
why these graphs go up or down with E and what is happening at the extremes of high and low E. (5 marks)
(b) As this problem is very simple, we do not really need a simulation, because we can solve the model exactly (which we will do later in this question). The point of this question is to show that the Monte Carlo method works in a simple case where we know what the answer should be.
Write a paragraph to describe how Monte Carlo simulations work in general, and how the Metropolis algorithm works. (5 marks)
(c) According to the Metropolis algorithm, if E/kT = -1, what should be the probability of
accepting a move from configuration 2 to configuration 1? What should be the probability of accepting a move from configuration 4 to configuration 3? The NetLogo program does not
move the middle two monomers, so the middle bond always stays vertical. Why do we not need to move these two monomers? What would happen if we allowed them to move? (5 marks)
(d) There are four types of configurations, as shown above, but some of these have more than one lattice configuration (i.e. more than one microstate). How many microstates are there in total? Draw all of the possible microstates.
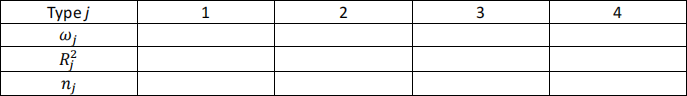
Let the number of configurations of type j be 幼j, let the square of the end to end distance for configurations of type j be Rj2, and let the number of bonds in type j configurations benj. Make
a table like this and fill in the numbers. (5 marks)
(e) Using your table, write down a formula for each of the following
• The partition function Z
• The mean value of the square of the end-to-end distance <R2>
• The mean value of the number of bonds <n bonds >.
(5 marks)
(f) In your Excel spreadsheet from (a), add columns to calculate Z, <R2>, and <nbonds >. Plot these theoretical values on the same graph as the values measured in the simulation and show that they fit the simulation data. (5 marks)
Part 2: Protein Denaturation by Urea 30 marks - distribution indicated in assignment
This exercise is based on the paper by Mello and Barrick (2004) – you can find a copy of the
paper on Avenue or here:https://doi.org/10.1073/pnas.0403386101 . Have a look at the paper for background information, but the key things you will need for this assignment are included below.
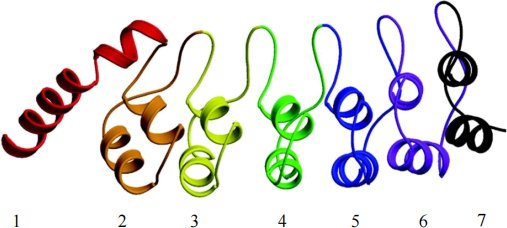
Figure 1 - Structure of the Nank1-7 protein
Figure 1 shows the structure of the Drosophila Notchankyrin protein (Nank). It consists of
seven small domains called 'repeats' that have roughly the same structure. In order to study the folding behaviour of this protein, shorter proteins were constructed in which some of these
repeats were deleted. The notation Nanki-j means that repeats from i to j inclusive are contained in the protein. The following proteins were studied:
Number of repeats nrep Protein
7 Nank1-7 (this is the full protein shown in Fig. 1) 6 Nank1-6, Nank2-7.
5 Nank1-5, Nank2-6, Nank3-7,
4 Nank1-4, Nank2-5, Nank4-7.
Proteins with three or fewer repeats did not fold to stable structures and were not studied.
Urea is a denaturant that causes proteins to unfold. The free energy of the unfolded state is defined as 0. It is assumed that the free energy for the folded state relative to the unfolded state, ΔG, depends linearly on the concentration of urea, U.
ΔGo is the free energy of the folded state in absence of urea, and misa constant. ΔGo is negative, which means the folded state is stable with respect to the unfolded state. As U
increases, ΔG becomes positive, and the folded state becomes unstable. According to the two- state theory
and the probability that the protein is unfolded is
(Note that this looks slightly different from the lecture notes, because here we are measuring down from the unfolded state instead of up from the folded state. Either of these is fine, but we need to remember which one we are doing!)
Circular dichroism (CD) was used to follow the denaturation of the Nank proteins. CD occurs
because of the presence of chiral protein molecules in a solution. The effect of these molecules on the polarized light is different for folded and unfolded proteins; hence measuring the CD
tells us how much protein is unfolded. For background information on how the technique works, see the document CD_spectroscopy.pdf - posted on Avenue.
Figure 2 shows the ellipticity, θ, measured by CD as a function of U for several different
proteins. More negative numbers correspond to a folded protein, and less negative numbers correspond to unfolded proteins. The ellipticity can be written as
where θ0 and θ1 are the ellipticities for the fully folded and fully unfolded states.
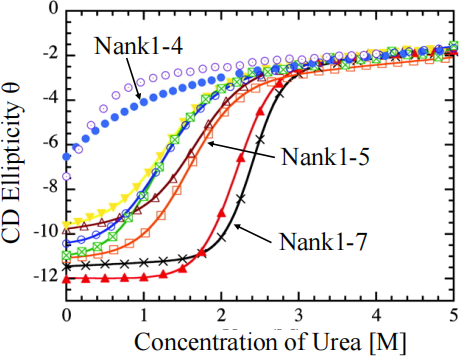
Figure 2 - CD measurements of protein denaturation by urea
(a) The experimental data for the Nank1-7 protein are shown in the table below. Copy this into Excel and plot a graph of θ against U. It should look like the Nank1-7 curve in Figure 2.
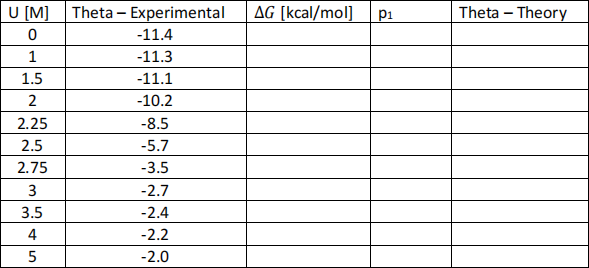
Calculate the values that go in the blank columns for ΔG, p1 and the theoretical value of θ. Then plot the theory curve for θon top of the data and show that the theory fits the data. To do this, you need the following information:
i. To calculate ΔG, assume that m = 2.85 kcal mol-1 M-1. Note from the graph that the half- way point of the transition is at about U = 2.4 M. From this, make an estimate of ΔGo. Now, calculate ΔG as a function of U (in column 3). Units of ΔG are kcal mol-1. (5 marks)
ii. To calculate p1, note that physicists use Boltzmann's constant kB = 1.38 x 10⁻²³ J K-1, while chemists use the molar gas constant R, which is kB times Avogadro's number 6.022 x 10²³. The molar gas constant is R = 8.31 J K-1 mol-1. Chemists often work with energy units of calories instead of Joules so R = 1.987 cal K-1 mol-1. You also need the absolute temperature in Kelvin. The experiment was done at 15°C. Remember: absolute zero (0 K) is -273.15 C. (5 marks)
iii. To calculate θ, assume that the U = 0 point is completely folded, and the U = 5 point is completely unfolded. Therefore θ0 = - 11.4 and θ1 = -2.0. If you have done all these steps correctly, the theory will match the experiment quite closely when you plot them on the same graph. (5 marks)
(b) Referring to Figure 2, comment both on the shapes of the curves and on what this tells you about the differences in the folding behaviour of the proteins Nank1-7, Nank1-5 and Nank1-4 whose curves are labelled on the graph. (5 marks)
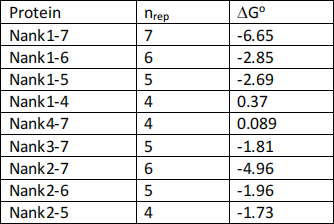
(c) The table below shows the free energies ΔGo for each of the proteins. These were estimated by more careful data fitting in the paper of Mello and Barrick. The value for Nank1-7 may be
slightly different from what you got from your estimate above. ΔGo depends on the number of repeats in the protein, nrep. It is proposed that ΔGo can be written in terms of a free energy of
folding of one repeat ΔGrep which includes all interactions between amino acids in one repeat and an interface free energy ΔGint that includes all interactions between one repeat and the
next. According to this model, the total free energy ΔGo should be a linear function of nrep. Plot a graph of the data in the table below, and use this to estimate the values of ΔGrep and ΔGint.
Describe how this model qualitatively explains the shapes of the curves in Figure 2, and explain why the proteins with three or fewer repeats did not fold. (10 marks).