关键词 > statistics代写
Homework #3.
发布时间:2023-10-26
Hello, dear friend, you can consult us at any time if you have any questions, add WeChat: daixieit
Homework #3.
Due online (NYU Brightspace – Assignments) on October 26 at 9:30AM. Late homework will NOT be accepted. No exceptions.
Instructions:
(1) Must be submitted as ONE SINGLE DOCUMENT
Acceptable formats: Word (.doc, .docx), PDF (.pdf), image (.jpg, .png) (2) Show your questions in order.
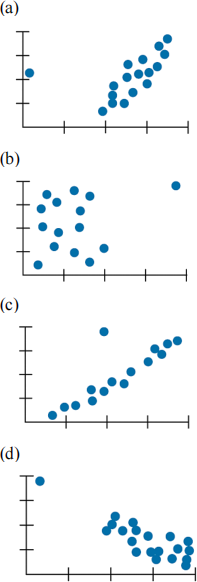
1. (20 points) Each of the following scatterplots shows a cluster of points and one “stray” point. For each, answer these questions: 1) Does it have high leverage, a large residual, or both? 2) Do you think that point is an influential point? 3) If that point were removed,
would the correlation become stronger or weaker? 4) If that point were removed, would the slope of the regression line increase or decrease?
2. (10 points) According to Pew Research, the contact rate (probability of contacting a selected household) was 90% in 1997 and 62% in 2012. However, the cooperation rate (probability of someone at the contacted household agreeing to be interviewed) was 43% in 1997 and dropped to 14% in 2012.
(a) What is the probability (in 2012) of obtaining an interview with the next household on the sample list? (To obtain an interview, an interviewer must both contact the household and then get agreement for the interview.)
(b) Was it more likely to obtain an interview from a randomly selected household in 1997 or in 2012?
3. (10 points) The American Red Cross says that about 45% of the U.S. population has Type O blood, 40% Type A, 11% Type B, and the rest Type AB.
(a) Someone volunteers to give blood. What is the probability that this donor 1) has Type AB blood?
2) has Type A or Type B?
3) is not Type O?
(b) Among four potential donors, what is the probability that
1) all are Type O?
2) no one is Type AB?
3) they are not all Type A?
4) at least one person is Type B?
4. (20 points) 56% of all American workers have a workplace retirement plan, 68% have health insurance, and 49% have both benefits. We select a worker at random.
(a) What’s the probability he has neither employer-sponsored health insurance nor a retirement plan?
(b) What’s the probability he has health insurance if he has a retirement plan?
(c) Are having health insurance and a retirement plan independent events? Explain. (d) Are having these two benefits disjoint events? Explain.
5. (15 points) An airline offers discounted “advance-purchase” fares to customers who buy tickets more than 30 days before travel and charges “regular” fares for tickets
purchased during those last 30 days. The company has noticed that 60% of its customers take advantage of the advance-purchase fares. The “no-show” rate among people who paid regular fares is 30%,but only 5% of customers with advance-purchase tickets are no-shows.
(a) What percent of all ticket holders are no-shows?
(b) What’s the probability that a customer who didn’t show had an advance-purchase ticket?
(c) Is being a no-show independent of the type of ticket a passenger holds? Explain.
6. (25 points) (Graphs must be printed or scanned from Excel)
To develop a way to estimate the weight of an alligator, the wildlife researchers measured the lengths and weights of several captured alligators. Then they used those data (on next page) to develop a model enabling them to estimate an alligator’s weight from its length – something they can guess from a safe distance! Officials hope to use this model to
identify alligators that should be relocated because they have grown so large as to pose a threat to humans.
|
Weight (pounds) |
Length (inches) |
|
83 |
86 |
|
70 |
88 |
|
61 |
72 |
|
54 |
74 |
|
44 |
61 |
|
106 |
90 |
|
84 |
89 |
|
39 |
68 |
|
42 |
76 |
|
197 |
114 |
|
102 |
90 |
|
57 |
78 |
|
130 |
94 |
|
51 |
74 |
|
640 |
147 |
|
28 |
58 |
|
80 |
86 |
|
110 |
94 |
|
33 |
63 |
|
90 |
86 |
|
36 |
69 |
|
38 |
72 |
|
366 |
128 |
|
84 |
85 |
|
80 |
82 |
(a) Use Excel, create a linear model to estimate an alligator’s weight from its length. Display the scatterplot together with the linear regression equation and R2.
(b) Use Excel, create the residual plot for the above regression.
(c) Discuss the appropriateness of the linear model.
(d) Use Excel, create a more appropriate model using power of 0 in the “ladder of
powers”. Display the scatterplot with the linear regression equation and R2, and create the residual plot for this new model. Justify why this new model is better.
(e) Using this new model, predict the weight of an alligator that is 100 inches long.
