关键词 > EASC8742/3742
Groundwater Modelling EASC8742/3742
发布时间:2023-08-19
Hello, dear friend, you can consult us at any time if you have any questions, add WeChat: daixieit
Groundwater Modelling EASC8742/3742
Simple steady state finite differencing by Excel spreadsheet
In this assignment you are asked to describe a simple steady state flow field through Finite Differences, implemented in Excel. The aquifer and its boundaries are presented in Figure 1. Hydrogeological investigations indicate that the confined aquifer may be considered to be
homogeneous and isotropic. The aquifer thickness is approximately 50 m throughout the study domain. Pumping tests indicate an aquifer hydraulic conductivity of 2 m/d and a specific storage of 5 x 10⁻⁵ m-1 . The aquifer is bounded by low permeable hard rock
mountainous regions to the north and west. In the east, a river acts as a boundary with river levels ranging from 100 m at the base of the mountains to 0 metres close to the sea. The
aquifer as well as the river drain into the ocean. Groundwater recharge to the aquifer has been estimated to be in the order of 50 mm/year.
An irrigation bore taps the aquifer and is situated ca. 550 m upstream of the ocean and 550 m to the west of the river, pumping at a rate of 1200 m3/d.
Produce a finite-difference approximation of the aquifer for a steady-state simulation in a spreadsheet format. Consider using a block-centred areal grid of 100 m by 100 m square cells. Assume groundwater flow is horizontal.
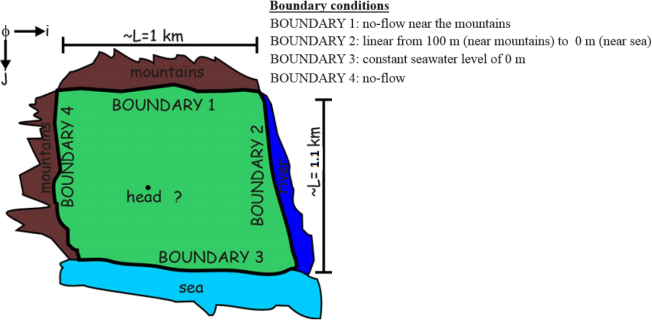
Figure 1: Model problem domain (Source: G.O. Essink, 2002)
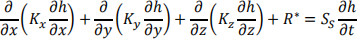
In a first step, set up a steady state model (i.e. ?h/?t = 0) without any additional fluxes (no
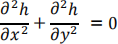
pumping, no recharge, i.e. R* = 0). Given that we assume horizontal flow (i.e. ?h/?z = 0 ), and a homogeneous, isotropic aquifer, the groundwater flow equation:
reduces to the 2-D Laplace equation:
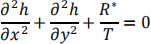
In a second step, we introduce aquifer stresses (pumping and recharge, i.e. R* ≠ 0). Thus, we use Poisson’s equation:
HINTS:
i) Download the Excel spreadsheet template from FLO. It provides you with the basic set-up of the model. However, you have to populate the model with the values for the model boundaries and the equations to be used for all active model cells.
ii) Note the solution requires an iterative calculation so you must allow for circular references in Excel: File > Options > Formula. Check “Enable iterative calculation”, then adjust maximum iterations and consider modifying the convergence criteria to get an accurate answer. Choose automatic update or manual.
iii) Read Anderson and Bair: “The Power of Spreadsheets” carefully (on FLO). It explains in detail, how the Laplace equation and Poisson’s equation are approximated using Finite Differences. It also explains how this approximation is implemented in Excel. As we later want to compare our Excel spreadsheet results with a MODFLOW model, which is block-centred, make sure you implement a block-centred grid in Excel.
In a block-centred grid, flow boundaries are situated at the edge of the cell, or half way between the midpoints of two adjacent cells. This can be set-up in Excel by implementing imaginary cells that are outside the problem domain along model boundaries, which contain no-flow boundaries. By simply mirroring the value inside the no-flow boundaries onto the model cell outside the model boundary, so that the head in, e.g. D3 equals the head in D4 (see spreadsheet on FLO), the standard finite difference equation (5-point operator) can be written for all cells inside the problem domain and your Excel spreadsheet emulates a block-centred model.
iv) Setting up the spreadsheet requires careful input! Always start with all parameters (k, b, Q, R) and boundary arrays having a non-zero value. Save your spreadsheet results under a new name often, as the spreadsheet can crash easily (problems which often occur are “divide by zero” or reference error). So, make sure you save at regular intervals under new names. If your model crashes you can then revert back to your last saved file.
v) Make sure you implement fluxes consistently. Recharge is applied to the model cells in mm/year and then needs to be converted to a volumetric flux by multiplying by the cell area (Δx*Δy). Pumping rates, however, are already given as a volumetric flux (e.g. m3/day).
Questions to be answered for this assignment; provide us with a copy of your spreadsheet: Question A: No pumping, no recharge (Laplace equation):
1) Please fill in all the orange boxes in the QA1-2 tab of the spreadsheet;
2) Without adding any fluxes (no pumping, no recharge), can we get a hydraulic head value, which is above the highest boundary head, or below the lowest boundary head?
3) Calculate inflows & outflows by Darcy’s law for every river cell and for every ocean cell of the
model. Make sure, when you calculate your head difference between boundary cell and aquifer, you calculate the difference in heads such that outflows are negative and flows into the aquifer have positive values.
4) Calculate the water balance of you model. Sum up all inflows and outflows. Calculate the MASS BALANCE (% error) as:
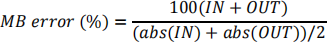
IN are positive fluxes of water moving into the domain, OUT are negative fluxes of water moving out of the domain, abs is the absolute function.
Question B: Now implement recharge and pumping into your Excel spreadsheet (Poisson’s equation):
1) Please provide a copy of your Excel spreadsheet head solution
2) Calculate inflows & outflows by Darcy’s law for every river cell and for every ocean cell of the model. Make sure, when you calculate your head difference between boundary cell and aquifer, you calculate the difference in heads such that outflows are negative and flows into the aquifer have positive values. Provide the answer in the spreadsheet tab Question B1-4.
3) Calculate the water balance of your model. Sum up all inflows and outflows. Calculate the MASS BALANCE (% error). Provide the answer in the spreadsheet tab Question B1-4.
4) Is it necessary to add recharge to constant head cells? Provide the answer in the spreadsheet tab Question B1-4.
5) When you neglect pumping, how does the model change if K and recharge are changed by the same factor? Why is this? Provide the answer in the spreadsheet tab Question B5.
6) Fill in the spreadsheet in tab Question B6 the head solution you obtain for the well cell for the following 2 solutions:
Solution 1:
Initial head estimate: 0 m
Convergence criteria: 0.1 m
Number of iterations: 10
Solution 2:
Initial head estimate: 0 m
Convergence criteria: 0.001 m
Number of iterations: 100
In order to start with an initial head of 0 m in the aquifer, you have to change the river boundary to 0 m everywhere, also set the recharge and the well discharge to 0 temporally. Now let the model
converge to 0 m everywhere in the aquifer (i.e. iterate manually with a small error). You then set the iteration parameters according to solution 1 or 2, specify the calculation to be done manually and then copy the correct river boundary condition (i.e. 100 m at the top to 0 m at the sea for the river), but also recharge and well extraction back into your model before you start your iterations.
Do this for solution 1 and then again go back to an initial head of 0, as above, and do solution 2. How different are the two head solutions for the well cell? And compared to the solution in question B1? Are convergence criteria and the number of iterations important?
