关键词 > SHSM024/SHSM030
SHSM024 / SHSM030 RESEARCH METHODS AND ANALYTICAL PROCEDURES 2021
发布时间:2023-08-15
Hello, dear friend, you can consult us at any time if you have any questions, add WeChat: daixieit
SHSM024 / SHSM030
College of Life and Environmental Sciences
SPORT AND HEALTH SCIENCES
January 2021
RESEARCH METHODS AND ANALYTICAL PROCEDURES
QUESTION 1: RESEARCH DESIGN, METHODS AND ETHICS (15 marks)
1.1 What is the purpose of obtaining informed consent in research? (3 marks)
1.2 When conducting a placebo controlled supplementation study, what is the purpose of blinding the researcher to the participant group? (2 marks)
Questions 1.3 through to 1.5 refer to information provided in the ‘Scenario’ below, please read the scenario before answering these questions
1.3 Did the researcher follow the correct protocol for obtaining consent? Explain your answer. (3 marks)
1.4 Is the design of this study ethical? Explain your answer. (4 marks)
1.5 Do you agree with the conclusions of the researcher? Explain your answer. (3 marks)
Scenario:
A researcher wishes to examine the effects of a physical activity intervention on obesity in teenagers. She intends to monitor the physical activity levels of participants in the study and then assess whether there is a relationship between levels of physical activity and levels of obesity. After this she will assign participants to either a physical activity group or a normal activity group. She obtains ethical approval from her university before starting the study and recruits via advertisements on Facebook. When she receives a response to her advertisement she asks the parents of the respondent to consent for their child to participate in the study after which she sends them the full study details. Once consent is received she sends a diary to the parents and asks them to fill out the activity of their child at the end of each week and send it back to her. She monitors activity levels of participants for two months. For 10% of participants she has missing diary sheets so she completes the activity profile for those weeks based on the activity levels in the other weeks. Her sample size calculation stated that she should recruit 60 participants for her study, however, after 30 participants she observes a significant relationship between physical activity levels and obesity so she decides to stop recruiting participants at this stage. Once she has finished the monitoring stage she assigns participants to the physical activity intervention group or the normal activity group. In order to ensure that participants benefit from the study she assigns participants with the highest levels of obesity to the physical activity group. At the end of the intervention she finds that the total weight loss is higherin the physical activity group. Based on this she concludes that her intervention was effective in promoting weight loss.
QUESTION 2: SYSTEMATIC REVIEWS AND META-ANALYSIS (10 marks)
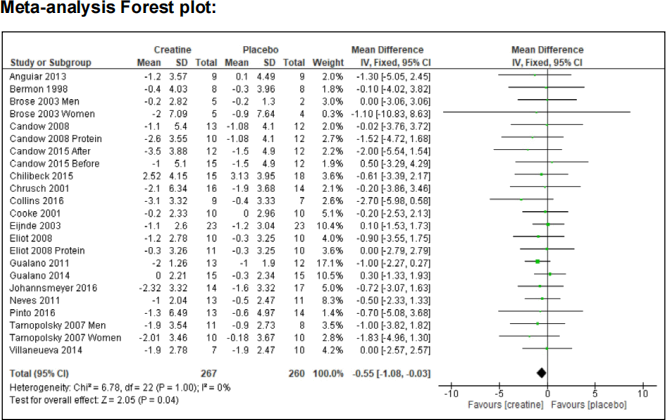
The Forest plot below reports the findings of a very recent ‘systematic review with meta-analysis’ on studies that had tested whether ‘creatine supplementation during resistance training’ reduced body fat% more than ‘placebo supplementation during resistance training’. The units of the outcome is ‘mean body fat% difference between the two groups (creatine and placebo).
2.1 Describe, in general terms, what the two main aims of any systematic review are (2 marks)
2.2 Based on the level of variation between the 23 study findings, indicate whether it was appropriate for the authors of the systematic review to produce a single summary estimate of all 23 findings (support your answer with relevant values and terms). (3 marks)
2.3 Summarise the results and conclusion of the ‘quantitative synthesis’ (Forest plot) that the authors performed as part of their systematic review, then compare them to the results and conclusion that would have been produced if a ‘qualitative synthesis’ approach been used to summarise the same 23 study findings (support your answer with relevant values). (5 marks)
QUESTION 3: ANALYSIS OF VARIANCE [ANOVA] (5 marks)
Use your knowledge of ‘one-way repeated measures ANOVA’ to answer part 3.1, and use the SPSS ‘two-way independent samples ANOVA bar chart’ below to answer part 3.2
3.1 In relation to ‘one-way repeated measures ANOVA’, describe what the assumption of ‘sphericity’ is (2 marks)
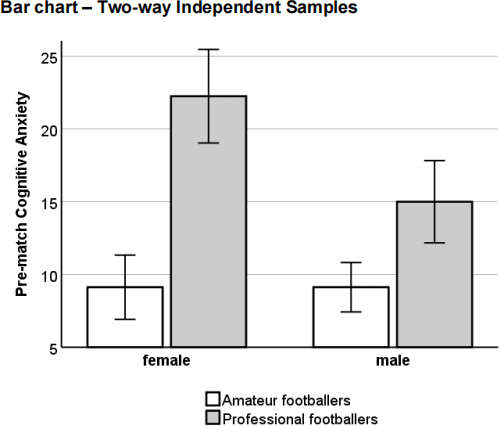
3.2 The ‘two-way independent samples ANOVA’ bar chart below reports the pre- match cognitive anxiety levels (mean & 95%CI) of footballers grouped by competition level (amateur and professional footballers) and by gender (female and male). Interpret the findings represented in this bar chart in lay terms – i.e. without using statistical terms. (3 marks)
QUESTION 4: SAMPLE SIZE AND STATISTICAL POWER (10 marks)
A researcher is designing a study to test the effectiveness of a 6-week ‘shoulder strengthening’ intervention on ‘serve speed’ in semi-professional male tennis players.
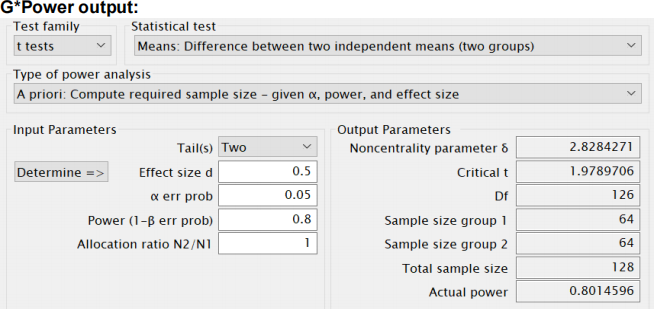
She has estimated that the ‘smallest meaningful’ effect that she wants her intervention to detect is a 5km/h (Cohen’s D = 0.5) higher serve speed - compared to the control group. Using this estimate of D=0.5, she calculates the sample size her study requires in order to achieve 80% statistical power at the 5% level of statistical significance.
Use the ‘G*Power’ output (below) to answer part 4.1 and use your knowledge of ‘sample size and statistical power’ to answer parts 4.2 through to 4.4.
4.1 According to the G*Power output (below), how many participants, in total, are required to provide complete data for this study (1 mark)
4.2 Explain why it would be unethical if the researcher decided to recruit a sample size that was 50% less than the one calculated by G*Power for D=0.5. (3 marks)
4.3 If the researcher decided that even a 1km/h (Cohen’s D=0.1) higher serve speed was important, state whether the re-calculated sample size for this smaller effect would be higher or lower than the sample size calculated for a 5km/h difference (D=0.5). (2 marks)
4.4 Explain what ‘80% power’ (and the remaining 20%) means, in terms of probability. (4 marks)
QUESTION 5: STEPWISE LINEAR REGRESSION (25 marks)
With karate being included as a new Olympic sport for the 2021 (postponed from 2020) summer Olympics in Tokyo, Team GB wanted to identify young female karate students (aged 14-16y) who had the potential to represent GB at the 2024 Olympic Games karate event. Team GB designed a batch of four tests to objectively assess four key aspects of karate ability. These tests were ‘Kicking accuracy’ (%: high is good)’, ‘10 Push-ups time (seconds: low is good)’, ‘30 Punches time (seconds: low is good)’ and ‘Flexibility: splits score (%: high is good)’ .
In order to determine whether these tests were indeed predictive of karate ability, a random sample of 25 young female karate students (at black belt level) who had carried out all four tests, were assessed for their karate ability (%: high is good) during several sparring sessions by Team GB top karate coach/instructor. The five variables were used in a Stepwise linear regression analysis (via forward selection) with ‘Karate Ability rating score’ as the dependent variable, and the four tests as the independent variables.
Use your knowledge of Stepwise linear regression methods to answer part 5.1, and use the SPSS Stepwise linear regression output below to answer parts 5.2 through to 5.5:
5.1 Describe the processes involved in Stepwise linear regression (via forward selection) and explain why it is relevant for this study. (6 marks)
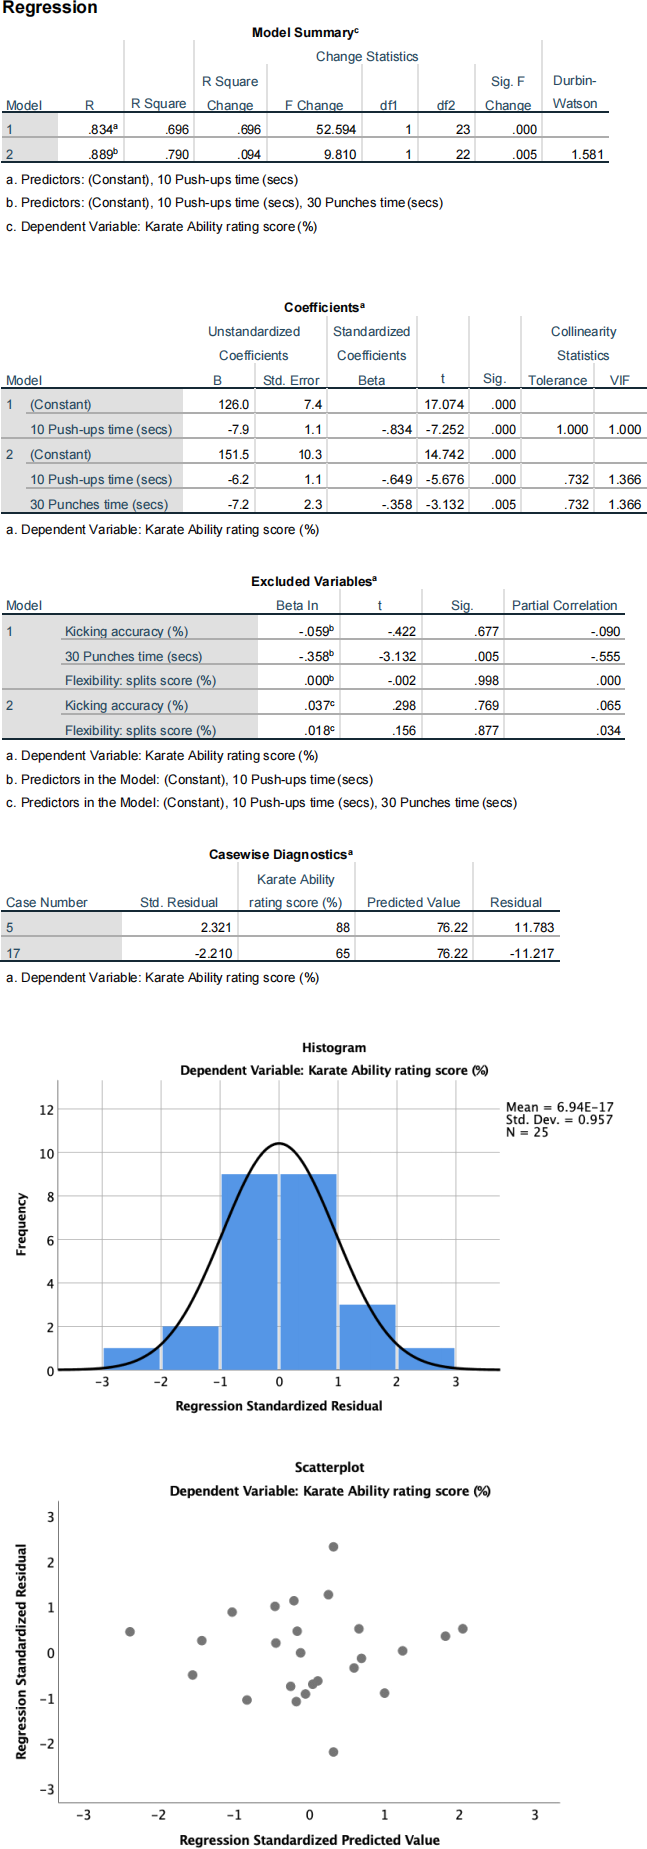
5.2 Identify and interpret the following three (most common) tests of assumptions for multiple linear regression analysis: No multi-collinearity of the independent variables, Normality of the residuals, Homoscedasticity of residuals (6 marks)
5.3 Describe how the regression model improved at each ‘step’ of the model building process (support your answer with relevant values and terms). (5 marks)
5.4 Interpret the ‘unstandardized B coefficients’ for each statistically significant IV in the final model (4 marks)
5.5 Based on the findings of this study, make a recommendation to Team GB regarding the tests they should use and make a recommendation to them regarding further research. (4 marks)
QUESTION 6: MODERATED HIERARCHICAL LINEAR REGRESSION (15 marks)
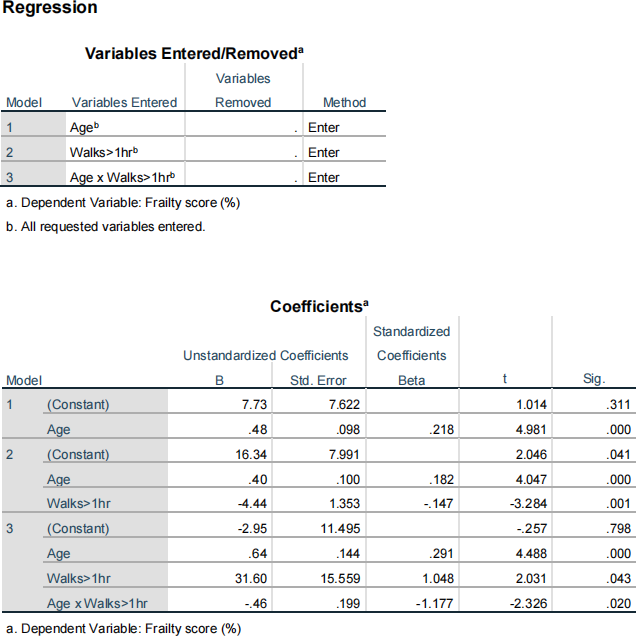
A PhD student was given access to three data variables that were collected as part of a large cross-sectional study of n~500 elderly (aged 65-100y) women in the UK. The three variables were: ‘Frailty score’ (continuous dependent variable: %: high % = more frail), ‘Age’ (continuous independent variable), time spent walking (dichotomous independent variable: 1 = Walks>1hr/wk, 0 = Walks≤1hr/wk). It has been shown many times that frailty increases with aging, so the PhD student wanted to examine whether ‘time spent walking’ moderated this age-related increase in frailty. In order to examine ‘moderation’, the student entered an ‘Age x Walks>1hr/wk’ interaction term in to a ‘hierarchical linear regression’ model.
Use your knowledge of ‘moderated hierarchical regression’ and the SPSS output below to answer parts 6.1 through to 6.3, and use your knowledge of study designs to answer part 6.4.
6.1 Describe the model building process involved in ‘hierarchical linear regression’ and explain why it is relevant for this study. (5 marks)
6.2 Using the information in Model 3 of the Regression table, predict the Frailty score(%) for an 80y old woman who walks for more than 1hr/wk. (3 marks)
6.3 Using the information in Model 3 of the Regression table, predict the Frailty score(%) for an 80y old woman who walks for less than 1hr/wk. (3 marks)
6.4 The PhD student concluded that “walking for more than 1hr/wk leads to a decrease in the Frailty score of elderly women”. However, the student’s supervisor pointed out to him that they were unable to say “leads to” because their study was cross-sectional and that such study designs cannot determine causality. Provide a concluding sentence that is relevant to this cross-sectional study design, and then recommend a study design that would be able to determine causality – that walking >1hr/wk leads to a decrease in Frailty score.
(4 marks)
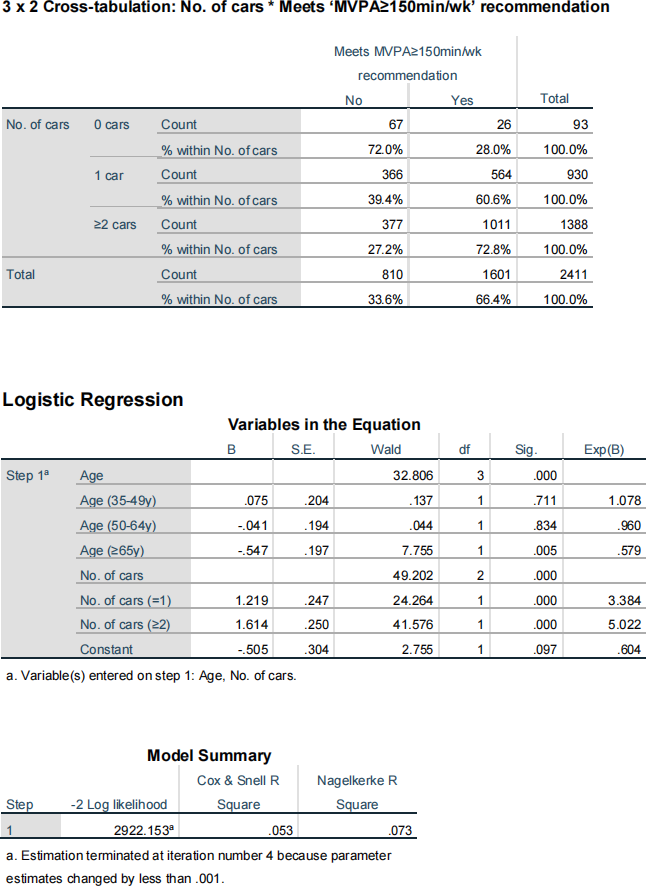
QUESTION 7: LOGISTIC REGRESSION (15 marks)
An epidemiology researcher analysed data collected from a ‘car ownership & physical activity’ survey of n~2500 adults living in rural villages in Devon, UK. The dependent variable was analysed as a dichotomous variable (meets the recommended 150min/wk of moderate-and-vigorous intensity physical activity [MVPA]: Yes=1 or No=0) using cross-tabulations and logistic regression. The two categorical independent variables were ‘no. of cars in the household’ (0 cars, 1 car, ≥2 cars) and ‘Age’ (18-34y, 35-49y, 50-64y, ≥65y)
7.1 Using the percentages reported in the 3x2 cross-tabulation below, calculate the Odds Ratio for meeting the ‘MVPA≥150min/wk’ recommendation when there are ‘≥2 cars’ in the household, compared to ‘0 cars’. (note that ‘Age’ is not factored into this calculation) (4 marks)
7.2 Using the information in the Logistic Regression table below, report and interpret the Odds Ratio of ‘meeting the MVPA≥150min/wk recommendation’ for ‘≥2 cars’ versus the reference group of ‘0 cars’ (reference group is not reported) when Age is factored into the model. (4 marks)
7.3 Using the information in the Logistic Regression table below, report and interpret the Odds Ratio of ‘meeting the MVPA≥150min/wk recommendation’ for ‘Age65y’ versus the reference group of ‘Age18-34y’ (reference group is not reported) when ‘no. of cars’ is factored into the model. (4 marks)
7.4 Explain, in general terms, what the ‘Cox & Snell R square’ value is used to assess and then interpret the value reported in the Model Summary table below. (3 marks)
QUESTION 8: AGREEMENT BETWEEN TWO MEASURES (5 marks)
A sports scientist measured the lean mass (in kg) of n=30 Exeter Chiefs male rugby players. Each player had their lean mass measured with two different methods: an expensive lab-based method (Dual energy X-ray Absorptiometry [DXA]) and a much cheaper, portable method (Bioelectrical Impedance Analysis scales [BIA]). The mean difference (calculated as ‘DXA - BIA’) and ‘95% limits of agreement’ on a Bland-Altman plot were +0.5kg and ‘-1.0kg to +2.0kg’ respectively.
8.1 Interpret the ‘mean difference’ and ‘95% limits of agreement’ value. (1 mark)
8.2 Interpret the ‘95% limits of agreement’ values. (2 marks)
8.3 What type of ‘correlation’ could the sports scientist use to measure the level of agreement between these two measurement methods? (2 marks)
