关键词 > Excel代写
Social Media Monitoring Exercise Walkthrough
发布时间:2023-08-15
Hello, dear friend, you can consult us at any time if you have any questions, add WeChat: daixieit
In this exercise, we will engage in social media listening to spot potential shifts in social media activity. Doing so can provide brands with an early warning of potential shifts in consumer perceptions. Based on this signal, brands can determine whether or not intervention is necessary. You have been provided with a data pulled from Crimson Hexagon for Starbucks for a three year period, covering 2014-2016. The provided data includes the daily volume of comments that have been classified as positive, neutral or negative.
Deliverables
Using this data, you are to identify days on which the social media activity of users (based on the volume of comments by sentiment) differs significantly from the social media activity of users over the preceding 2 weeks. Detailed instructions are provided on the next pages.
You should submit:
1) The Excel workbook in which you conduct your analysis
2) A Word document describing how you analyzed the data to identify these specific days, and your findings from Google as to the events that may explain the shift in social media activity. Your writeup should not exceed 5 double-spaced pages.
Social Media Monitoring Exercise Walkthrough
Create Your Metrics
You have been provided with daily counts of the number of positive, neutral and negative comments pertaining to Starbucks. We will use these to construct two measures: (1) daily volume, and (2) Positive-to-Negative Ratio.
Type “Daily Volume” in cell E2 and “Positive-to-Negative” in cell F2.
In cell E3, add up the total number of comments pertaining to 1/1/2014:
=sum(B3:D3)
Copy this formula down the worksheet by selecting cell E3, moving the cursor to the lower-right corner of the cell, and double-clicking. Alternatively, you can click-and-hold in the lower-right corner, and then drag your mouse down the column.
In cell F3, calculate the ratio of positive-to-negative comments from 1/1/2014:
=B3/D3
Copy this formula down the worksheet.
Calculate your test statistics
With columns E and F now populated, we will use each metric to identify those days on which the current day significantly differs from the previous two weeks.
In cell G3, type “Volume Test Statistic.” Type “Ratio Test Statistic” in cell H3.
As we are comparing the current day to the preceding 2 weeks, 1/15/2014 is the first day on which we have the necessary data to perform this comparison.
In cell G17, enter the following formula:
=(E17-AVERAGE(E3:E16))/(STDEV (E3:E16)/SQRT(14))
This produces the T-statistic so that we may compare the volume of comments observed on 1/15/2014 (in cell E17) against what has been observed in the preceding two weeks (cells E3:E16).
To compare the ratio of positive-to-negative sentiment observed on 1/15/2014 to the preceding two weeks, enter the following in cell H17:
=(F17-AVERAGE(F3:F16))/(STDEV (F3:F16)/SQRT(14))
Copy the formulas in G17 and H17 down their respective columns
Identifying significant shifts
For a T-test with 13 degrees of freedom, the critical value corresponding to the 95% confidence level is 2.16. That is, for any values in column G and H that are either greater than 2.16 or less than -2.16, we can conclude that these values differ significantly from the preceding two weeks.
For our purposes, we will focus on the following scenario: days on which the volume of comments is higher than usual, and the ratio of positive to negative comments is lower than usual. Highlight the rows in the Excel spreadsheet that correspond to these days.
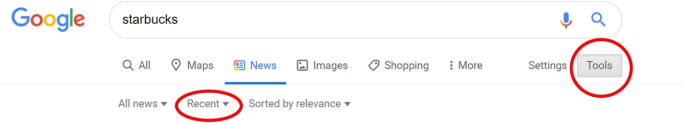
Once you have identified the days on which social media activity differs from the activity in the preceding two weeks, select 3 of these days and use Google News to identify the events that may have contributed to the shift in social media activity. As illustrated below, you can restrict your search results to specific data ranges.
Based on your search results, can you identify particular types of events that result in an increase in negative social media activity or would you describe the shifts in social media activity as idiosyncratic?
