关键词 > MSINM014/MSING014
MSINM014/MSING014 DECISION & RISK ANALYSIS ─ 2013/2014 FINAL EXAM
发布时间:2023-08-12
Hello, dear friend, you can consult us at any time if you have any questions, add WeChat: daixieit
MSINM014/MSING014
DECISION & RISK ANALYSIS ─ 2013/2014
FINAL EXAM
Part I: Simulation
FluVacTech is a U.K. based influenza (flu) vaccine manufacturer and owns a large-scale production plant in Liverpool. FluVacTech grows the flu vaccine in fertilized chicken eggs through a very complex and long (over 6 months) production process. The vaccine production for 2014-15 flu season (i.e., from October 2014 to January 2015) starts in February 2014; therefore, the production manager at Liverpool plant must determine the production quantity (i.e., the number of eggs to be fertilized) before then. The FluVacTech believes that each egg will cost anywhere between £6 and £8 to fertilize.
One of the main challenges in flu vaccine production is the uncertain yield. Due to complex nature of vaccine production via chicken eggs, actual number of vaccine doses obtained will be a random proportion of the number of eggs fertilized (i.e., actual number of vaccine doses = U × number of eggs fertilized, where U is the proportional yield). Based on information given by flu vaccine experts, the production manager thinks that the number of vaccine doses obtained from one unit egg (i.e. U) will be between 0.5 and 4, with 1 being the most likely estimate.
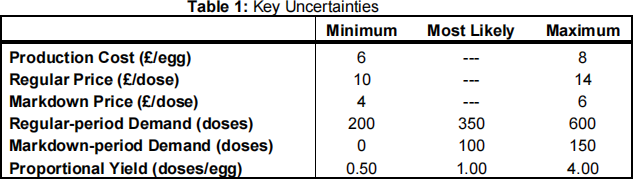
The FluVacTech divides the vaccination season into two (regular and markdown) periods. During the regular period (October 2014 and December 2014), the vaccine will be sold for anywhere between £10 and £14 per dose, and the demand is minimum 200, most likely 350, and maximum 600. Flu vaccines not sold in the regular period, if any, are sold for anywhere between £4 and £6 per dose in the markdown period (January 2015). FluVacTech estimates the demand during the markdown period to be minimum 0, most likely 100, and maximum 150. Any vaccines still left over after January 2015 will be destroyed at no cost. Table 1 below summarizes key uncertainties or main risk factors for FluVacTech.
Question 1. Scenario Analysis
Using the most likely estimates for demand in regular and markdown periods, and the proportional yield as her best guesses, the production manager decides to fertilize 350 eggs.
(i) Using the key uncertainties (risk factors) presented in Table 1 and assuming the production quantity (i.e., number of eggs fertilized) is 350, determine the equation for the profit of FluVacTech in 2014-15 flu season (i.e., revenue in the regular period + revenue in the markdown period - costs). (Hint: First, using Table 1, write down the equation for actual number of vaccine doses available at the beginning of the regular period and then the equation for the leftover inventory at the end of the regular period. Use these equations and Table 1 to determine the profit equation.)
(ii) Assuming the production quantity (i.e., number of eggs fertilized) is 350, what are the best-case and worst-case scenarios based on the profit equation you obtained in part (i)? What is the range for the profit?
Question 2. Simulation - Input Distributions
To perform a simulation analysis, we need to identify an appropriate probability distribution to model each of the risk factors.
(i) What is wrong with production manager making the production decision based on her best guesses? Why is simulation analysis necessary?
(ii) Determine an appropriate distribution and their parameters for each of the risk factors listed in Table 1.
Question 3. Simulation – Discussion of the Results
Assuming number of fertilized eggs is equal to 350, you have used the distributions specified above to perform a simulation analysis (1,000 iterations) using @Risk and produced the following output.
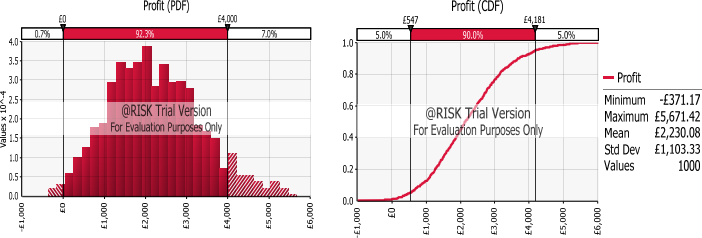
(i) Determine the average profit of FluVacTech when the number of fertilized eggs is 350, and carefully explain what it means.
(ii) What is the chance that the FluVacTech earns less than £4,000 but does not make any loss (i.e., positive profit) in 2014-15 vaccination season?
(iii) What are the realistic downside and upside in terms of the profit level? How does this realistic range compare to the scenario analysis in part (ii) of Question 1?
Question 4. Managing Risk – Sensitivity Analysis
Examine the tornado diagram from the @Risk.
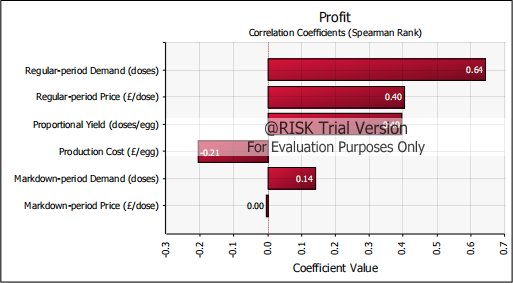
(i) What information does a tornado diagram provide in general? What do you observe from the tornado diagram above?
(ii) Is it worth money and time to reduce the variability in regular-period demand? How about markdown-period price?
Part II: Optimization
The Grafton Clinic is a small private care provider located in central London. It purchases influenza vaccines exclusively from FluVacTech. Each September, the NHS distributes money to hospitals and care providers to purchase vaccines, with the mandate to vaccinate as many people as possible. This year, the Grafton Clinic was given a budget of £3,000.
It is now September 2014, and the whole-sale price of the flu vaccine that is available to the clinic is £10/shot in the regular period (October-December 2014). This price is set to fall to £5/shot in the markdown period (January-February 2015). Due to a recent outbreak of a new variant of the influenza virus, there is an exceptionally high demand for the vaccine. In particular, the Grafton Clinic estimates that the demand in the the regular period is 600 and the demand in the markdown period is 100. The Grafton Clinic is trying to decide how to utilize their given budget to achieve their objective of vaccinating the most number of people. Any leftover vaccines from the regular period can be used to vaccinate people in the markdown period. Also, any demand that is not satisfied in the regular period will be lost (i.e. they will go to a different clinic).
Question 5. Optimization Model
Construct an optimization model. In particular, what are the decision variables? In terms of the decision variables, list the objective and constraints formally as you would do prior to constructing an Excel model.
Question 6. Optimization Solution
(i) What is the optimal number of people that Grafton Clinic is able to vaccinate? (Hint: you do not need to rely on Excel Solver for this question).
(ii) Suppose you had access to Excel Solver, which gives you the same answer as above. Can you be sure that the solution is optimal?
Question 7. True or False (Feasible Sets & Shadow Prices)
Circle “T” if the statement is true and “F” if the statement is false.
(i) ( T / F ) The Grafton Clinic can satisfy all demand for the flu vaccine in the regular period.
(ii) ( T / F ) The Grafton Clinic can satisfy all demand for the flu vaccine in the markdown period.
(iii) ( T / F ) If the demand for vaccine in the markdown period increases by 10, the Grafton Clinic will vaccinate more people.
(iv) ( T / F ) If the budget for purchasing vaccines increases by 100, the Grafton Clinic will vaccinate exactly 10 more people.
(v) ( T / F ) If the demand for vaccine in the regular period increases by 30, and the demand for vaccine in the markdown period decreases by 10, the Grafton Clinic will vaccinate more people.
Part III: Decision Analysis
When a flu shot, which consists of small doses of three types of flu virus strains, is injected into a person, that person develops immunity to the three particular virus strains. Unfortunately, having immunity for one strain of virus does not protect fully against another strain of virus. Thus, the efficacy of the vaccine depends on whether the virus strains in the vaccines match the prevailing virus strains. To make matters worse, the flu viruses constantly undergo mutations. Thus the vaccine composition must be reviewed and, if necessary, changed each year to match the circulating virus strains.
To this end, the Joint Committee on Vaccination and Immunisation (hereafter, Committee), convenes every February to discuss and to recommend the annual vaccine composition to the UK health department. Immediately afterwards, the vaccine manufacturers (e.g., FluVacTech) start the 6-month long production of the vaccines containing the recommended composition to sell them to care providers (e.g., Grafton Clinic) in September before the flu season begins.
It is now February 2014. The decision of the Committee anchors around which Type B strain to add to the vaccine composition. Last year, the Type B/Victoria strain had been used, but recent reports suggest that a new strain called Type B/Yamagata strain is becoming prevalent (e.g., in the past two months, the prevalence of the Yamagata strain increased rapidly from 10% to 40%). Due to the ecology of the viral evolution, either the Yamagata strain or the Victoria strain will become the dominant Type B strain by the flu season in October, but which of the two scenarios would occur remains highly uncertain at this point (i.e. assume 50-50 chance). The vaccine cannot contain both Type B strains.
If the vaccine contains the correct Type B strain, it will have 95% efficacy (i.e., out of 100 vaccinated people, only five will suffer from the flu). However, if the vaccine contains an incorrect Type B strain, it will have 80% efficacy rate. Considering the lengthy manufacturing process, the Committee believes that the announcement in February will enable the UK vaccine manufacturers to produce 1 million flu shots prior to the flu season in October. All of the vaccines that are produced will be used. Any delay in their recommendation will adversely affect the supply of flu shots. The goal of the Committee is to recommend the vaccine so as to maximize the total number of people who are successfully immunized.
Question 8. Decision Tree
(i) Construct the decision tree characterizing the decisions faced by the Committee, filling in the appropriate number for each branch/node. Compute the expected value of the tree, and comment on the robustness of the decision.
(ii) Suppose the manufacturing lead time was very short (i.e. 1 million flu shots can be produced in 1 day). Construct another decision tree highlighting how the decision of Committee would change.
(iii) What is the loss in the expected number of successful vaccinated people caused by the long production lead time?
Question 9. Delaying the Decision
To help countries make decisions on the annual virus composition, the World Health Organization (WHO) has established a global surveillance network to monitor the development of prevailing strains in different regions. The Committee is contemplating whether or not to delay the recommendation by one month. By delaying the decision, the manufacturer’s production quantity will suffer by 5% (i.e. only 950,000 flu shots will be available). However, it could enable the Committee to better estimate of the chances of which of the two Type B strains (Yamagata or Victoria) will become the dominant strain (via WHO).
In particular, after one month, if the prevalence of Yamagata strain continues to increase rapidly, it expects that with 90% probability the Yamagata strain will become the dominant strain by October 2014. If the Yamagata’s prevalence slows, it expects that with 80% probability the Victoria strain will become the dominant strain by October 2014.
(i) Construct the decision tree that occurs after the decision to wait. Fill in the appropriate numbers for each node.
(ii) State the risk profile associated with the committee’s decision of delaying the decision, and that associated with not delaying the decision.
Question 10. Final Recommendation
(i) Incorporating the decision of whether or not to delay the recommendation, what is the optimal strategy for the Committee?
(ii) What is the expected number of successfully vaccinated people under the optimal strategy?
