关键词 > 4QQMN136/146
4QQMN136/146 Introduction to Micro/Macroeconomics Examination 2022/23
发布时间:2023-08-02
Hello, dear friend, you can consult us at any time if you have any questions, add WeChat: daixieit
Examination 2022/23
Module Code and Title: 4QQMN136/146 lntroduction to Micro/Macroeconomics
Examination period: Exam period 2, May 2023
Time allowed: 3 hours plus 30 minutes, submission time.
1. Question 1 (25 marks)
The demand and supply curves for hats at KCL are as follows:
P = 90 - 6*Qd and P = 3*Qs, where price is ε (British Pounds) per hat and quantity is measured in hats.
(a) what is the equilibrium price and quantity in this market? lllustrate the equilibrium graphically. [5 marks] [Note: make sure to label your graph ade- quately.]
(b) suppose the student government at KCL introduces a price ceiling for hats at ε21 per hat. How many hats are exchanged at that price? How does the introduction of the price ceiling afect producer surplus? lllustrate the change in producer surplus graphically and calculate its monetary value. [10 marks]
(c) suppose the government commits to providing any excess demand in this market at ε21 per hat once the price ceiling is implemented by paying sup- pliers for any losses. what is excess demand and what price would suppliers need to receive from the government? what will be the cost to the student government of providing this excess? [10 marks]
2. Question 2 (25 marks)
Table 1 sets out sue,s surfboards, total product schedule.
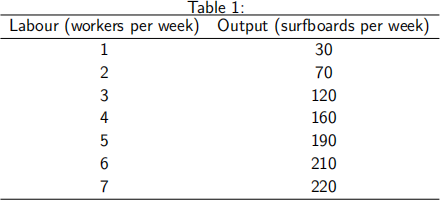
(a) Calculate the average product of labour and the marginal product of labour. Draw the total product curve, the average product curve and the marginal product curve within the same diagram. [10 marks]
(b) over what output range does sue,s surfboards enjoy the beneits of increased specialization and division of labour? [2 marks]
(c) over what output range does sue,s surfboards experience diminishing marginal product of labour? [2 marks]
Read the news clip, which is copied right below, titled “Najran cement shuts Down second Production Line”, then answer questions d, e and f.
News clip:
A second production /ine of Najran cement has been temporari/y shut down owing to poor market conditions. The company stated that any inancia/ efect of this decision wi// be pub/ic/y announced.
source: globalcement.com, March 9, 2017
(d) Explain the inancial efect mentioned in the news clip in terms of TFc, TVc, and Tc. [3 marks]
(e) Explain the inancial efect of the shutdown in terms of proit maximization or loss minimization. [4 marks]
(f) why is the decision to shut down the second production line temporary? [4 marks]
3. Question 3 (25 marks)
ln the following exercise we consider the production and the long run growth of diferent economies. our starting point is a simple model of the cobb-Douglas production technology with a capital share in production of 1/3, and a labor share in production of 2/3.
1 2
(a) First, let,s consider the simplest cobb-Douglas technology as yt = kt3 Lt(3) .
convert the cobb-Douglas production function into per capita terms. why might we be more concerned about per capita output rather than total output when discussing the welfare impacts of economic growth? [5 marks]
(b) show how the adjusted production function looks like if we also consider total factor productivity (TFP). How does the production function look like in per capita terms? why do we think that it is a good idea to augment the production function with the TFP? [5 marks]
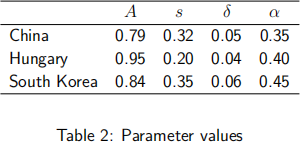
(c) Now consider the general solow model with per capita production function
given by gt = Akt(a), to determine which country has the highest steady-state
level of capital and output using the following data in Table 1. Assume that labor is ixed and we can deine the population of any country in such a way that it is equal to one. which country has the highest steady-state per capita capital stock and output per capita? which country has the lowest? [5 marks]
(d) Explain the likely driving forces behind your answers in (c). [5 marks]
(e) Let,s focus on Hungary and assume that the economy is in its steady-state represented by the capital and output per capita levels that were calculated in (c). Now consider that TFP in Hungary increases from 0.95 to 1. using the solow Diagram, show how the economy adjusts to this structural change. How do capital per capita and output per capita evolve over time? [5 marks]
4. Question 4 (25 marks)
Assume that aggregate demand in the economy is given by
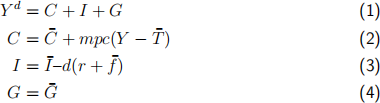
Assume there is no external sector in the economy.
(a) Derive and plot ls curve. Explain clearly the interpretation of the ls curve. what is it capturing? [5 marks]
(b) Assume that the monetary policy rule in this model is simpliied to r = ![]() , hence no inlation is present in the model, and the interest rate is set exogenously by the central bank. Derive the equilibrium of the model and show it graphically. [5 marks]
, hence no inlation is present in the model, and the interest rate is set exogenously by the central bank. Derive the equilibrium of the model and show it graphically. [5 marks]
(c) Explain how-the ls curve shifts in response to a decrease in taxes, i.e. a decrease in T. lf T decreases by 1, will the ls curve shift by 1, by more than 1 or by less than 1? Assume that government spending remains the same. [5 marks]
(d) suppose the government decreases taxes, while keeping government spending unchanged. can the central bank in principle change the stance of monetary policy to avoid that the change in taxes afects the equilibrium level of output? Discuss how any component of aggregate demand changes. can you think of a reason why the central bank executes this monetary contraction? [5 marks]
The above model economy does not feature inlation nor inlation expectations, and does not feature a phillips curve.
(e) Explain what the phillips curve is and the diference between the short run and the long run phillips curve. [5 marks]
