关键词 > FINM3008/6016
FINM 3008/6016 Applied Portfolio Construction Tutorial #10
发布时间:2023-06-15
Hello, dear friend, you can consult us at any time if you have any questions, add WeChat: daixieit
FINM 3008/6016 Applied Portfolio Construction
Tutorial #10 – Outline
Question 1 – Hedging and Returns
On the course Wattle site can be found the file “Tutorial #10 - Analysis File.xlsx”. If you choose to answer this question using excel, data can be found in the worksheet ‘QUESTION 1 – Hedging and Returns’. Alternatively, you could use a calculator (please show workings) and the information below:
Data as at 28th April 2023 (Sources: RBA and Fed St. Louis):
A$ exchange rate versus US$ (spot, US$ per A$1) 0.6633
Australian 6-month interest rates (6 months bank bill) 3.82% pa
Australian 12-month interest rates (12 months note) 3.40% pa
US 6-month interest rates (6 months Treasury constant maturity) 5.00% pa
US 12-month interest rates (12 months Treasury constant maturity) 4.64% pa
Calculate the following, and interpret the results:
a) Forward exchange rates for both 6-months and 12-months
b) Unhedged and hedged 12-month A$ return on a US asset whose value remains unchanged in US$, under three different assumptions for the spot exchange rate in 12-months time:
· Spot moves to the current 12-month forward exchange rate
· Spot moves to the current 12-month forward exchange rate plus 10%
· Spot moves to the 12-month forward exchange rate less 10%
Question 2 – Hedge Ratio Estimates
This question examines the currency hedging decision from the perspective of an Australian investor. The file “Tutorial #10 - Analysis File.xlsx”, contains the following worksheets relevant to this question:
- “Q2 – Return Data” worksheet: This contains quarterly returns for Australian equities, world equities in A$ (hedged and unhedged), and Australian fixed income. (Comment: For this exercise, the asset classes are being kept to a bare minimum.) It also includes weightings for three portfolios, all with 40% in Australian equities, 30% in world equities and 30% in fixed income. The ‘benchmark’ portfolio (BP) has world equities 50% hedged (15% hedged WE / 30% total WE). It can be thought of as reflecting the SAA for the investor and/or their peer group. The ‘zero-exposure’ portfolio (ZP) is the equivalent portfolio with all overseas assets 100% hedged, and thus contains no exposure to foreign currencies. The ‘unhedged’ portfolio (UP) is the same portfolio with WE held 0% hedged.
- ‘QUESTION 2 - SUMMARY’ worksheet: Set up to generate results. It has links to the “Returns” worksheet. Both long term period back to 1985 and latest 10 years are investigated.
- “Q2 - PPP Data” worksheet: This contains CPI data (quarterly averages) for the US and Australia, calculations of purchasing power parity (PPP) for Australia relative to the US, and quarterly values for the A$/US$ exchange rates from 1969. It also contains 2 charts for your viewing pleasure of PPP versus the A$/US$, and the percentage deviation of the A$ from PPP.
- “Q2 - 10-yr Rolling MinVar HR”: Chart set up to plot correlation between currency and the portfolio, plus the minimum variance hedge ratio. This series will be populated once you have completed the worksheets.
The task involves estimating certain cells in the ‘Q2 – Return Data’ and then ‘QUESTION 2 – SUMMARY’ worksheets. The cells you need to complete are shaded, and currently show a value of 0.
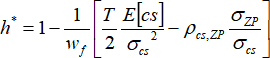
Optimal Hedge Ratio Formula
You are going to use the data provided to generate a various estimates of the ‘optimal’ hedge ratio (h*) based around equation (1) below:
 (1)
(1)
where h* = optimal hedge ratio
wf = weighting of foreign assets in the portfolio (in this case, world equities)
T = risk tolerance. Use T = 0.66667
E[cs] = expected returns from currency surprise, i.e. forecasted return differentials of unhedged and hedged portfolios as a results of foreign currency deviating from the forward exchange rate
σcs = standard deviation of currency surprise
σZP = standard deviation of zero-exposure portfolio
rcs,ZP = correlation between currency surprise and zero-exposure portfolio
Part I: Estimating the main inputs
You need to calculate return series in the ‘Q2 – Return Data’ worksheet for all three portfolios (BP, ZP, UP; columns F, G, H), and returns from currency surprise (cs, column K). A cs proxy can be formed from the difference in returns between unhedged and hedged world equities, where cs = (1+rWE,unh)/(1+rWE,h)-1. Once you have formed these series, the statistical measures below will be calculated within the ‘Q2 – Return Data” worksheet. The estimates are linked into the ‘QUESTION 2 – SUMMARY’ worksheet, where Part II can be completed.
· Annualized compound return for BP, ZP, UP, ZP-BP, UP-ZP and cs
· Annualized standard deviation for BP, ZP, UP, ZP-BP, UP-ZP and cs
· Correlation between the zero-exposure portfolio and cs
Part II – Hedge ratio estimates
Now estimate the optimal hedge ratio (h*) using equation (1) for ‘cases’ (i.e. sets of inputs) listed below:
Case Estimates for σcs, σZP, ρcs,ZP Estimate for E[cs]:
1 Historic data, Mar’85-Dec’22 Historic data, Mar’85-Dec’22
2 Historic data, Mar’85-Dec’22 Set = 0 (i.e. estimate minimum variance h*)
3 Last 10 years, Mar’13-Dec’22 Last 10 years, Mar’12-Dec’22
4 Historic data, Mar’85-Dec’22 Historic data, Mar’85-Dec’22 + mean reversion term#
# Incorporate the expectation that the US$/A$ is currently $0.6697 as at end of March 2023 (3% below long term PPP value), and will revert to PPP of US $0.6935 evenly over a 2-year period. Formula: E[cs] = historic cs + ([current US$/A$]/PPP)^(1/2)-1
Discussion Points:
a) Examine the mean and standard deviation for the cs proxy series, as well as its correlation with ZP. What does it tell you about the effect of adding exposure to foreign currency to an Australian portfolio?
b) Can you say whether hedged or unhedged world equities would have delivered a superior outcome for an Australian investor in the period after 1984? What about in the past 10 years? (Hint: see column P in ‘Q2 - Return Data’ spreadsheet.)
c) How substantial is the benchmark-relative risk arising from currency hedging decisions? (Hint: see ‘Differences’ in column I in ‘Q2 – Return Data’ spreadsheet.)
d) Examine the various estimates of the optimal hedge ratio. What insights can you draw?
Question 3: Setting the Hedge Ratio
An Australian superannuation fund asks you how they might go about setting their hedge ratio. List the considerations that they might take into account.
(Hint: See Pereira and Leung (2007) as well as Lecture 10 for guidance.)
