关键词 > ECMT6006/ECON4949/ECON4998
ECMT6006/ECON4949/ECON4998 Applied Financial Econometrics 2021 S1 Final Exam
发布时间:2023-06-03
Hello, dear friend, you can consult us at any time if you have any questions, add WeChat: daixieit
ECMT6006/ECON4949/ECON4998 Applied Financial
Econometrics 2021 S1 Final Exam
Problem 1. [14 marks] Answer the following questions on the return forecasta- bility.
(i) We introduced three concepts for different levels of dependence which may exisit in a financial asset return series. What are they?
(ii) How are these three concepts for different levels of dependence related to each other?
(iii) Take a simple AR(1) model for example, explain the relationship between return predictability and autocorrelation of the returns.
(iv) If you cannot reject the null hypothesis that a return time series follows a white noise process at a certain significance level (say 1%), what can you say about the forecastability of this asset return?
(v) What is the limitation of using ARMA type of models to examine return forecastability?
(vi) Why do we say that Value-at-Risk (VaR) is often a better risk measure than volatility in the financial industry? How is return VaR related to the return volatility?
(vii) Why is it important to forecast the return VaR and Expected Shortfall in the financial risk management?
Problem 2. [12 marks] Consider the following stationary AR(1)-GARCH(1,1) model for stock returns:
Rt = 60 + 61 Rt − 1 + et
et = 7t ut
7t(2) = u + aet(2)− 1 + 87t(2)− 1
ut lrt − 1 ~ F (0, 1)
where l61 l < 1, u > 0, a, 8 > 0, a+8 < 1, 7t > 0, rt − 1 denotes the information
set up to time t - 1, and F (0, 1) denotes some distribution with mean 0 and variance 1.
(i) Show that {et(2)} is an ARMA(1,1) process.
(ii) Show that the GARCH(1,1) model for {et } is equivalent to ARCH(o).
(iii) Decompose the unconditional variance of Rt into two components con- tributed from its conditional mean and conditional variance. Which com- ponent dominates the other as you see from the empirical data in class?
(iv) How would you modify the model to capture the potential “leverage effect” in the stock market?
(v) How would you obtain the feasible one-step ahead two-standard-deviation interval forecast of the returns at time t?
(vi) How would you construct the feasible two-step ahead two-standard-deviation interval forecast of the returns at time t?
Problem 3. [6 marks] We decompose an asset return Rt into the conditional mean μt and the error component et as
Rt = μt + et ,
and consider choosing a volatility model for et .
(i) Using the squared residuals eˆt(2) as the volatility proxy, we estimate the following Mincer-Zarnowtiz (MZ) regression
eˆt(2) = 80 + 81 ht + ut
where ht is the actual volatility forecast from a certain volatility model, and ut is the regression error term. How would you use a hypothesis test to evaluate whether a certain forecast ht is optimal, based on the above regression? Write down the null and alternative hypotheses and explain how to conduct the test.
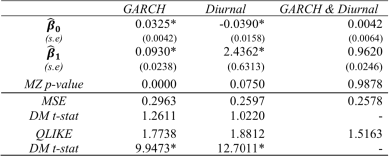
(ii) Consider three different volatility models to obtain the volatility forecast ht . They are (a) pure GARCH model, (b) pure diurnal model, and (c) GARCH model with diurnal component. The estimation and testing re- sults are summarized in the below table. Please interpret the results of the MZ regression on evaluating the optimality of each model.
(iii) The results of the DM tests with MSE or QLIKE loss functions are also reported in the above table. Interpret the results.
Problem 4. [10 marks] Answer the below questions on Value-at-Risk (VaR) and Expected Shortfall (ES) forecasting models.
(i) Explain how to use the RiskMetrics model and the Normal-GARCH(1,1) model to forecast the 1% return VaR and ES.
(ii) How are the RiskMetrics model and the Normal-GARCH(1,1) model re- lated, and how are they different from each other?
(iii) How would you use the generalised Mincer-Zarnowitz regression to test whether the 1% return VaR forecasts VaR![]() for t = 1, . . . , T from the RiskMetrics model is optimal? Be explicit about the regression model, the null and alternative hypotheses, and how to test the null hypothesis.
for t = 1, . . . , T from the RiskMetrics model is optimal? Be explicit about the regression model, the null and alternative hypotheses, and how to test the null hypothesis.
(iv) How would you use the generalised Mincer-Zarnowitz regression to test whether the 1% return ES forecasts Es![]() for t = 1, . . . , T from the RiskMetrics model is optimal? Be explicit about the regression model, the null and alternative hypotheses, and how to test the null hypothesis.
for t = 1, . . . , T from the RiskMetrics model is optimal? Be explicit about the regression model, the null and alternative hypotheses, and how to test the null hypothesis.
(v) Suppose you have obtained two VaR forecasts, VaR![]() and VaR
and VaR![]() for t = 1, . . . , T , from the RiskMetrics model and the Normal-Garch(1,1) model. How would you compare these two forecasts using the Diebold- Mariano test?
for t = 1, . . . , T , from the RiskMetrics model and the Normal-Garch(1,1) model. How would you compare these two forecasts using the Diebold- Mariano test?
Problem 5. [8 marks] Answer the below questions on volatility forecast eval- uation.
(i) Explain how you evaluate the one-day ahead forecasts of a daily volatility model using (pseudo) out-of-sample method.
(ii) Explain why we need to use volatility proxy for evaluating the performance of a volatility model.
(iii) What is the proposed proxy if we only have daily data for the stock price?
(iv) How can we improve the daily volatility forecast evaluation tests using intra-day stock price data? Explain why there is a such improvement.
