关键词 > STAT8150/7150
STAT 8150/7150 Assignment 2
发布时间:2021-04-26
Bayesian Data Analysis Assignment2: Due Week 8, 2021
STAT 8150/7150
1. Question 1 (6 marks)
You are designing a very small experiment to determine the sensitivity of a new security alarm system. You will simulate five robbery attempts and record the number of these attempts that trigger the alarm. Because the dataset will be small you ask two experts for their opinion. One expects the alarm probability to be 0.95 with standard deviation 0.05, the other expects 0.80 with standard deviation 0.20.
(a) (3 marks) Translate these two priors into beta PDFs, plot the two beta PDFs and the corresponding mixture of experts prior with equal weight given to each expert.
(b) (3 marks) Now you conduct the experiment and the alarm is triggered in every simulated robbery. Plot the posterior of the alarm probability under a uniform prior, each experts’ prior, and the mixture of experts prior.
2. Question 2 (14 marks)
The data in the table below are the result of a survey of commuters in 10 counties likely to be affected by a proposed addition of a high occupancy vehicle (HOV) lane.
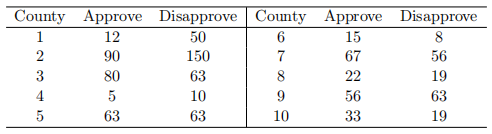
(a) (4 marks) Analyze the data in each county separately using the Jeffreys’ prior distribution and report the posterior 95% credible set for each county.
(b) (3 marks) Let
be the sample proportion of commuters in county i that approve of the HOV lane (e.g.,
= 12/(12 + 50) = 0.194). Select a and b so that the mean and variance of the Beta(a, b) distribution match the mean and variance of the sample proportions
, . . . ,
.
(c) (4 marks) Conduct an empirical Bayesian analysis by computing the 95% posterior credible sets that results from analyzing each county separately using the Beta(a, b) prior you computed in (b). (Reminder: empirical Bayesian analysis means you have used the observed data to define your prior).
(d) (3 marks) Present he credible sets in the same plot for each county obtained from (a) and (c). How do the results from (a) and (c) differ?
3. Question 3 (12 marks)
In this question we revisit the Question 2 from your first assignment. The NBA free throw data are the same as before:
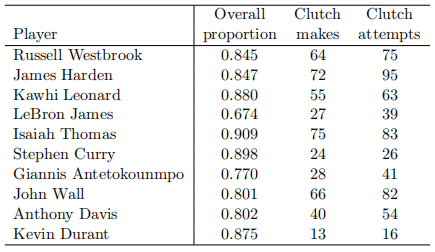
We will fit the following model:

where Yi is the number of made clutch shots for player i = 1, . . . , 10, ni is the number of attempted clutch shots, qi ∈ (0, 1) is the overall proportion, and m ~ Normal(0, 10).
(a) (2 marks) Explain why this is a reasonable prior for θi.
(b) (2 marks) Explain the role of m in the prior.
(c) (3 marks) Derive the conditional posterior for θ1: π(θ1 | m, θ2, . . . , θ10, Y1, . . . , Y10).
(d) (3 marks) Fit your model in JAGS and comment your code.
(e) (2 marks) Present the 95% credible interval for all parameters of your model.
4. Question 4 (8 marks)
Suppose there are 10 power plant pumps. The number of failures of those 10 pumps follows a Poisson distribution i.e. Xi ~ P oisson(θiti), i = 1, 2, . . . , 10 where θi is the failure rate for pump i and ti is the length of operation time of the pump (measured in 1,000s of hours). The dataset is summarised into the following table:
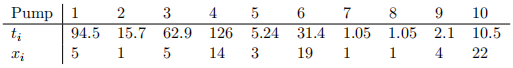
A conjugate gamma prior distribution is adopted for the failure rates:

with a and b also have their prior distributions as

(a) (2 marks) Draw the DAG (Directed Acyclic Graph) corresponding to this model.
(b) (4 marks) Implement the above model in JAGS (comment your code).
(c) (2 marks) Is there any pump that appears to be broken down more often than the others?
