Econ508 Makeup Second Midterm
Makeup Second Midterm
Econ508
Spring 2021
Dr. Ani Dasgupta
Instructions: Answer all questions. the first question carries 50 points, the other two 25 points each. For the STATA questions, I need to see the do-files and a log file demonstrating that your do-file/program actually works. Partial credits are available, so even if you do not achieve full success in a problem, show me how far you were able to get. You are allowed to use any book or internet resource provided you offer full attribution. You are not allowed to consult any human being. Number your pages. On the first page of your submission, please write, sign and date this pledge: “I pledge my honor that I have not consulted another human being for my answers to the questions on this test.” Good luck!
1. On the topic of instrumental variables and (also while discussing autocorrelation), we have taled about the so-called ‘expectation-augmented’ Phillips curve. It starts with the equation:
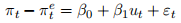
where πt is the inflation in period t,
is the (expected) inflation of period t (formed in period t − 1)
is the inflation in period t,
is a ‘supply shock’ in period t.
Next, we model the expected inflation using adaptive expectations:
. Replacing πte we have an equation that can be estimated. In the notes we talked about why this model should not be estimated by OLS because it creates endogeneity if we have AR1 disturbances
. Here, you will estimate it via 2sls (see equation (23) in notes on the IV chapter).
Go to the website https://www.cengage.com/aise/economics/wooldridge_3e_datasets/ to download datasets from Prof. Jeff Wooldridge’s econometrics booksite where you will find a dataset called ‘Phillips’ which has information for macroeconomic variables from 1948 to 1996.
(a) Assume that unemployment also follows an AR1 process:
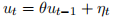
but the η’s are uncorrelated with the v’s. Why might be two
and
act as good instruments?
(b) Estimate α, β0 and β1 by 2sls. Show that if you computed things by actually running two stage regressions, you will get the same results.
(c) Are your instruments ‘strong’ or ‘weak’? Justify.
(d) Run the overidentification test. What exactly are you testing here?
(e) Run the Hausman test. What are you testing here?
(f) The natural rate of unemployment is that rate at which inflation is not changing from year to year. Estimate the natural rate from your model.
(g) Noting that Stata stores the variance-covariance matrix after an estimation exercise in e(V) (just like it stores the coefficients in e(b)), use delta method to build a 95% confidence interval for the natural rate.
2. Consider problem 6 in the previous midterm. Suppose the Poisson variable represents number of hospital emergency patients in each hour between 12 midnight to 12 noon (the first one was # admitted between midnight and 1 am). Test via a likelihood ratio test that whether the concerned hour was before or after 6 am, did not make a difference. One way is to define a dummy variable x indicating whether the observation was before or after 6 am. Now posit the model that λ = β0 + β1x and test β1 = 0.
3. Create a program, which takes a variable as an input and returns as a scalar how many observations are more than three sample standard deviations away from the mean.
GOOD LUCK!
2021-04-21