STAT0017 ICA 2: Spatial Statistics
STAT0017 ICA 2: Spatial Statistics
Released: 26 March 2021 at 4pm (UK time)
Submission deadline: 30 April 2021 at 4pm (UK time)
● Answer ALL questions.
● You may submit only one answer to each question.
● The relative weights attached to each question are Question 1 (20 marks), Question 2 (14 marks), Question 3 (16 marks)
● The numbers in square brackets indicate the relative weights attached to each part question.
● Marks are awarded not only for the final result but also for the clarity of your answer.
Administrative details
Basic details
● This assessment counts for 50% of your final mark for STAT0017.
● You must work alone on this assessment.
Plagiarism and collusion
The Department of Statistical Science, and UCL more broadly, takes plagiarism and collusion very seriously.
The following definitions of plagiarism and collusion are taken from the UCL Academic Manual.
Plagiarism is defined as the “representation of other people’s work or ideas as the student’s own without appropriate referencing or acknowledgement”.
This includes, but is not limited to:
● Using sources (online or otherwise) without reference;
● Using graphics, figures or pictures taken from elsewhere without reference.
Collusion is defined as “unauthorised collaboration by two or more students on any assessment”.
This includes, but is not limited to:
● Discussing the assessment in any way with another student, even if only verbally or via messages/emails;
● Sharing ‘tips’ with other students;
● Helping another student in any way with the assessment, even if only verbally (note: helping another student counts as collusion, even if you’re just trying to be nice!);
● Working on the assessment with another student;
● Sharing work with other students.
In short: do not talk about the assessment, or share your work, with any other student.
The penalties for academic misconduct such as plagiarism and collusion are severe. You can find more about plagiarism and collusion, as well as penalties, in the UCL Academic Manual (https://www.ucl.ac.uk/academic-manual/chapters/chapter-6-student-casework-framework/section-9-student-academic-misconduct-procedure). You may also find the Department of Statistical Science’s guide to plagiarism and collusion (https://www.ucl.ac.uk/statistics/sites/statistics/files/shbpc.pdf) helpful.
Your submission will be screened via Turnitin to check for plagiarism and collusion.
If there is any doubt as to whether the solutions you submit are entirely your own work, you may be required to participate in an investigatory viva to establish authorship.
Preparing your work
● You should use LaTeX, MS Word or RMarkdown to prepare ONE pdf document that contains your solutions for all questions / part-questions.
Submitting your work
Your work needs to be submitted by 4pm on 30 April 2021 via Moodle. A link to submit your work will be available from 4pm on 23 April 2021, a week prior to the submission deadline.
● You should not put your name anywhere on your submission; use your student number instead. Your submission will be marked anonymously.
● Name your file (the .pdf version) using convention ‘STAT0017ICA2_studentnumber’. For example, if my student number is 123456789 then I’d submit a file named ‘STAT0017ICA2_123456789.pdf’.
○ Do not use any other naming format.
○ Do not under any circumstances use your name as part of the file name.
○ You must include your student number; please don’t give your submission a generic name like ‘STAT0017ICA’.
● If you have any difficulties with submitting your work via Moodle, do not email me your work. Please email our Exams Liaison Officer, Dr Russell Evans ([email protected] (mailto:[email protected])).
● Any extension to the deadline can only be granted where a student has a SoRA or has successfully claimed extenuating circumstances. If you have a SoRA and wish to activate the coursework deadline extension, please contact me (Serge Guillas) within one week of the release date to arrange this. Extenuating circumstances are handled by your parent department and not by the teaching department.
○ If your parent department is Statistical Science, you should complete an Extenuating Circumstances webform.
○ For all other students, please follow your parent department’s guidelines.
Question 1 [20 marks]
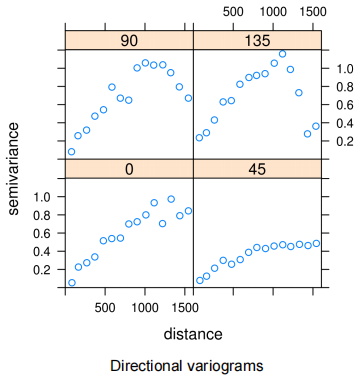
1. We compute, for the data set of zinc concentrations near a river, the variograms according to directions. Comment on the variations in these 4 variograms. [12]
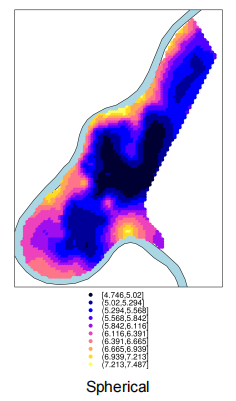
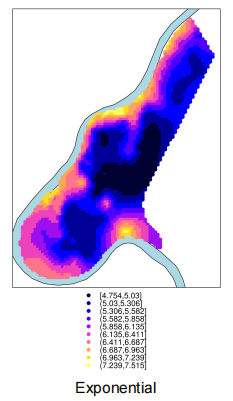
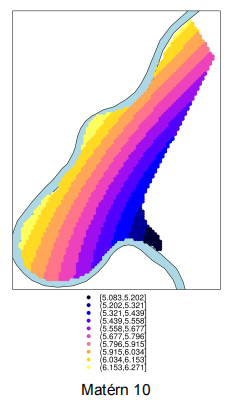
2. We then fit the anisotropic variograms from spherical, exponential, Matérn (ν = 2), Matérn (ν = 10) families to the data. (a) Comment on the surfaces predicted using ordinary kriging below using these four fitted variograms. (b) Relate the physical variations predicted to the variograms in question 1. [8]

Question 2 [14 marks]
Consider the semivariogram, defined for positive constants  :
:
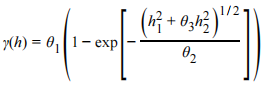
where h1
is the first component (E-W) and  is the second component (N-S).
1. What would be the matrix A that enables geometric anisotropy here? In other words, find the matrix A and identify the isotropic semivariogram
such that
. [7]
2. If, compute the ratio of the effective range in the E-W and N-S directions. [7]
Question 3 [16 marks]
Load the data set “temp.txt” using temp<-read.table(file=‘temp.txt’, header=T).
It has three columns: locations x and y (in km) and value t of temperatures at these locations.
1. Produce and plot an empirical variogram. [4]
2. What happens when you try to estimate the parameters of a Matérn covariance model using ML or REML? Can you offer a possible explanation? [3]
3. In order to implement the INLA-SPDE approach, create a mesh for the whole region (using the locations of the data or a rectangle from minimum and maximum of x and y) with a reasonable choice of number of triangles (through their size using the largest allowed triangle edge length), using the function inla.mesh.2d. Plot the resulting mesh along with the locations of the data points. Explain and illustrate your choices. [2]
4. Carry out a prediction of the data over a grid of dimension 1000x1000, showing mean and standard deviation. [2]
5. Illustrate the computational cost of the INLA-SPDE approach with respect to the mesh size. [3]
6. What would be the best choice of mesh size for this problem? What can you conclude in terms of the benefits of INLA-SPDE for this data set? [2]
NB: The last two questions are very open-ended questions. The clarity of your answer will be assessed as well its content. MSc students are expected to show deeper insight and the marking scheme for Level 7 students will reflect this.
2021-04-20