CS4221/CS5421 Project 5 - Serialisability
CS4221/CS5421
Project 5 - Serialisability
INSTRUCTIONS
1. Submit one ZIP file, <student number>.zip (for example: “A012345L.zip”), containing the following files to the folder ”Submissions” in Luminus
“Files > Projects > Serialisability” by Friday 16 April 2021 at 18:30.
• A text file named answers.txt.
• Three image files named question1.jpg, question2.jpg, and question3.jpg or question1.png, question2.png, and question3.png.
2. There is no late submission possibility.
The isolation level of a transaction defines how and when the changes made by this transaction are visible to other transactions. Isolation levels define the control of concurrency. They have an effect on the throughput and the correctness of the results of a transaction.
The SQL standard defines four levels of transaction isolation: read uncommitted, read committed, repeatable read, serializable. PostgreSQL allows the programmer to set the isolation level to one of these four levels. You can read and understand how the transaction isolation levels work in PostgreSQL.
We want to compare the effect of the four different isolation levels on the throughput and on the correctness of the results of a transaction.
Use Python 3 and SQLAlchemy library to answer the questions. The required library is already installed in the Virtual Machine (refer to the Toolbox document).
We set the following experiment. The database contains a single account table that records the account number, branch number, and balance of accounts. Although the account number is the primary key of the table , the primary key is not declared. The domain of each of th ethree columns is INTEGER. There are two types of transactions: sum, which calculates the sum of all account balances, and exchange, which exchanges the balances of two arbitrary accounts. The experiment consists in running several such transactions in parallel at different isolation levels. There is one sum process, which runs S sums in sequence. There are P exchange processes, each of which runs E exchange transactions in sequence. These processes are executed concurrently.
Download the ZIP file “project5.zip” from Luminus “Files > Projects > Serialisability > Code”. The ZIP file “project5.zip” contains the following files:
• Five python files named db_connect.py, run_sums.py, run exchanges.py, run_all_exchanges.py, and run_experiments.py.
• A text file named answers.txt.
Run the PostgreSQL database and create a database.
The ZIP file contains the Python file to run the experiment.
The Python file db_connect.py connects to the database.
Open the file db_connect.py and make sure that the database connection information (e.g. dbname, username, password) is correct.
The Python file run_sums.py runs S sum transactions in sequence. It takes S and I as inputs, where S is the number of sums and I is the isolation level (READ_UNCOMMITTED, READ_COMMITTED, REPEATABLE_READ, SERIALIZABLE). The code calculates the sum of all balances over the account table S times in sequence with isolation level I and returns all sum values upon completion.
The Python file run_exchanges.py runs an exchange process that runs E exchange transactions in sequence. It takes E and I as inputs, where E is the number of exchanges, and I is the isolation level (READ_UNCOMMITTED, READ_COMMITTED, REPEATABLE_READ, SERIALIZABLE). The code swaps the balance of two accounts E times in sequence with isolation level I with a 0.1 ms pause in-between transactions. The code retries the transaction in case of serialisation failures. The file returns the execution time and the number of retries.
The Python file run_all exchanges.py runs P exchange process in parallel. It takes E, P and I as inputs, where E is the number of exchanges in a subprocess, P is the number of subprocesses, and I is the isolation level (READ_UNCOMMITTED, READ_COMMITTED, REPEATABLE_READ, SERIALIZABLE). The code runs P run_exchanges.py concurrently. The code measures and returns the list of execution time and the list of number of retries of all exchange processes.
The Python file run experiments.py creates and populates the table and runs the experiment. It creates the account table and populates it with 10000 records where the account number is from 1 to 10000, the branch number is a random value between 1 and 20, and the balance is the same as the account number. It takes S, E, P and I as inputs, where S is the number of sums, E is the number of exchanges in a exchange process, P is the number of exchange processes, and I is the isolation level (READ_UNCOMMITTED, READ_COMMITTED, REPEATABLE_READ, SERIALIZABLE). The following command runs the experiment with 1000 sums, 100 exchanges in 10 exchange processes, and REPEATABLE READ level.
python3 run_experiments . py 1000 100 10 REPEATABLE READ
The code first calculates the initial sum of all balances over the account table. This value is called the true sum. The code runs the run_sums.py and run_all_exchanges.py codes concurrently with their respective parameters. Because of the concurrent access, the calculated sums may now be incorrect. The code calculates correctness which is the number of correct sums (from the output of run_sums.py with respect to the true sum). The code measures and returns the execution times for each exchange process, the number of retry for each exchange process, and the number of correct sums.
Run the file 20 times for each isolation level and for a number of exchange processes varying from one to ten in increment of one (this is a total 800 executions).
For each execution set the following parameters.
• Set the isolation level I.
• Set the number of sums S.
• Set the number of exchange processes P between one and ten (i.e. P = {1, 2, 3, . . . , 10}).
• Set the number of exchanges E per exchange process to the nearest integer such that the total number of exchanges E × P is constant.
Feel free to modify or to create additional Python files to automatise some of or all of the experiment. You do not need to submit these files.
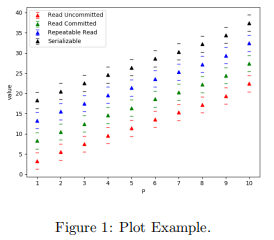
In the three questions below, use the following four colours in the plot to represent each of the four different isolation levels: read uncommitted is red, read committed is green, repeatable read is blue, and serializable is black. In each one of the three plots, indicate each isolation level name and its colour in the legend of the plot. Figure 1 shows an example of the plot. The triangle shows the mean value over 20 experiments, the line below the triangle shows the minimum value over 20 experiments, and the line above the triangle shows the maximum value over 20 experiments.
Feel free to use any tools/libraries for the plotting (e.g. matplotlib in Python). You do not need to submit the code files. Only submit the image files for the resulting three plots (in JPEG or PNG format).
For the plots below hoose the values of S and E×P that sufficiently differentiate the different isolation levels for the varying number of exchange processes for your machine. Different machines with different amount and type of memory, different numbers of processors of different speed yield different results. We recommend to start with S = 1000 and E × P = 1000.
Question 1 [2 marks]
Plot the mean, maximum, and minimum percentages of correct sums over the twenty executions for a number of exchange processes varying from one to ten in increment of one and for each isolation level. Draw all the plots on one figure. The x-axis of each plot is the number of exchange processes. The y-axis of each plot is the percentage of correct sums. The legend indicates the name of each isolation level plotted and its colour. Save the figure in an image file in JPEG or PNG format named “question1.jpg” or “question1.png”, accordingly. The plot shoud show thatREAD_COMMITTED and READ_UNCOMMITTED yield more incorrect sums.
Question 2 [2 marks]
Plot the mean, maximum, and minimum percentages of retried exchanges over the twenty executions for a number of exchange processes varying from one to ten in increment of one and for each isolation level. Draw all the plots on one figure. The x-axis of each plot is the number of exchange processes. The y-axis of each plot is the percentage of retried exchanges. The legend indicates the name of each isolation level plotted and its colour. Save the figure in an image file in JPEG or PNG format named “question2.jpg” or “question2.png”, accordingly. The plot shoud show different numbers of retry for actually different levels.
Question 3 [2 marks]
Plot the mean, maximum, and minimum average execution time for one exchange over the twenty executions for a number of exchange processes varying from one to ten in increment of one and for each isolation level. Draw all the plots on one figure. The x-axis of each plot is the number of exchange processes. The y-axis of each plot is the average execution time. The legend indicates the name of each isolation level plotted and its colour. Save the figure in an image file in JPEG or PNG format named “question3.jpg” or “question3.png”, accordingly.
Question 4 [0 marks]
(Penalty applies if this section is incomplete.) Report the values of S and E × P that you use for the experiments. Indicate the characteristics of the machine that you use (number of processors, processor type, main memory size and type, and harddisk type). Indicate ”VM” if you used the School’s virtual machine. Note that you may be called to reproduce your experiments with the teaching team. Write your answer in the space indicated in the template file “answers.txt”.
Question 5 [4 marks]
Synthesise concisely the observation that you can make from all of the plots. Namely, describe what you observe and check them with the documentation. Formulate a brief overall conclusion. Write your answer in no more than 500 words in the space indicated in the template file “answers.txt”.
– END OF PAPER –
2021-04-14