ECMT3150: Assignment 1 (Semester 1, 2021)
ECMT3150: Assignment 1 (Semester 1, 2021)
Lecturer: Simon Kwok
Due: 5pm, 12 April 2021 (Monday)
Note: Please include your R codes in an appendix at the end of your answers.
1. Bob, a budding investor, wants to model the movement of stock price over time. Let  denote the stock price movement indicator at time t, given by:
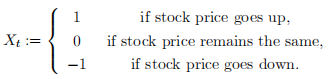
Bob assumes that  is a Markov process, i.e., the distribution of conditional on its history only depends on
  . Further-more, Bob specifies the following joint probability distribution of
  and :
and :
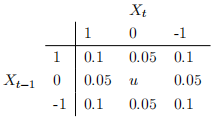
1. (a) Find the value of u.
(b) Find the marginal distribution of
(c) Find the unconditional mean of
(d) Find the unconditional variance of
(e) Find the conditional distributions of
(f) Find the conditional means of
(g) Find the conditional variances of
(h) Is {
(i) Is {
(j) Is {
2. Carol, an amateur economist, proposes the following time series model for unemployment rate:
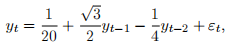
where 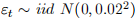 (normal distribution with mean 0 and variance
  ). The time period is measured in number of quarters.
(a) Show that the time series {yt} generated by model (1) is stationary.
(b) There is a stochastic cycle in the time series generated by model (1). Find its periodity in number of quarters.
(c) Compute the ACF for the first 3 lags, i.e., p(1), p(2) and p(3).
(d) Write an R program to simulate a sample path of fytg over 30 years. Set the initial values y0 and y-1 to be y0 = 0.1 and y-1 = 0.12. While simulating the random numbers for
, set the random seed to be your last 4 digits of your SID (this is to ensure that your answer will be di§erent from that of other students).
(e) Plot the sample ACF and record its value for the first 3 lags (the values can be retrieved from the acf command output stored as a list). Why are they di§erent from your answers in part (c)?
(f) Using the simulated sample path in part (d), estimate an AR(2) model using the R command arima. Write down the estimated model with the parameter estimates and their standard error. Also record the estimated variance of the innovations. [Important note: the "intercept" estimate in the arima output is in fact the unconditional mean; see Rob Hyndmanís page for details: https://robjhyndman.com/hyndsight/ arimaconstants/.]
(g) Using the simulated sample path in part (d) and the R package forecast, plot the point forecast and the confidence interval for each period over the next 5 years. Describe the short-run and long-run behaviour of the point forecast and the confidence interval.
3. (Ex: 2.8 of RT) Consider the data set of the previous question (i.e., Ex: 2.7 of RT, with data set d-ibm3dxwkdays8008.txt), but focus on the daily simple returns of the S&P composite index.1 For convenient reporting of parameters estimates, please express the daily simple re-turns in percentage (i.e., multiply by 100). Perform the necessary data analysis and statistical tests using the 5% significance level to answer the following questions:
(a) Is there any weekday effect on the daily simple returns of the S&P composite index? You may employ a linear regression model to answer this question. Estimate the model, check its validity, and test the hypothesis that there is no Friday effect. Draw your conclusion.
[Hint: note that the five weekday dummies are collinear. You may either drop one of them, or include all of them in a regression without intercept (implemented using lm(y~x1+x2+...+xn+0)). The latter approach is more convenient for testing the Friday effect.]
(b) Check the residual serial correlations using Q(12) statistic. Are there any signiÖcant serial correlations in the residuals? If yes, build a regression model with time series errors for the data.
[Hint: If you use auto.arima, the option xreg=c(var1,var2,...) allows you to include regressor variables. If you want to include all five weekday dummies, you need to suppress the intercept using the option allowmean=F to avoid collinearity.]
2021-04-13