ECON 6002 Practice Mid-Semester Exam (with answers)
Practice Mid-Semester Exam (with answers)
ECON 6002
James Morley
The actual mid-semester exam will be 90 minutes (+30 minutes upload time) starting at 6pm (AEST) on Tuesday, 20 April. The exam will be open book. The practice mid-semester exam is 60 minutes (+30 minutes upload time).
Examinable Material and Expectations:
1. The mid-semester exam will cover material from Weeks 1-5, corresponding to Romer, Chs. 1-5. Anything covered in class, on the three tutorials, or on the first problem set is examinable.
2. I will provide relevant formulas such as production functions to be used in answering a question (see questions below to see examples of what sort of material will be provided and what you might be assumed to know).
3. You will be expected to understand the “economics” behind any equations provided.
4. In answering questions, be precise, showing all of the steps, and indicate if you are making any assumptions along the way.
Practice Mid-semester Exam Questions and Answers:
1. In the Solow-Swan model, steady-state consumption is c* = f(k*) − (n + g + δ)k* . Let n = 0.05, g = 0.1, and δ = 0.1.
(a) In addition to the Inada conditions, what is the condition in terms of the sum of n, g, and δ for a unique steady state with positive k* to exist? What is the numerical value of n + g + δ for this economy?
It is necessary for n + g + δ > 0 for there to be a steady-state with positive k∗ . This is because steady state is determined by the crossing of the actual investment line (which takes on positive values for k > 0) and the break-even investment line, which has slope n + g + δ. These will only cross for positive k if the slope of the break-even investment line is positive (the lines also cross at k = 0, but then k would not be positive). The value of n + g + δ for this economy is 0.25.
(b) Solve for the “Golden Rule” capital per unit of effective labour,
, that maximizes consumption if f(k) = kα, α = 0.5, n = 0.05, g = 0.1, and δ = 0.1.

2. In the Ramsey model, the Euler equation describes the optimal growth path of consumption per person as
.
(a) Explain in economic terms why r(t) > ρ leads to
> 0?
If the real interest rate is higher than the discount rate, then households are relatively patient and will save today to increase consumption tomorrow. Thus, they choose a path of consumption that has them increasing consumption over time until they reach a steady-state in which
= 0.
(b) Why does the particular growth rate of consumption depend on θ (recall 1/θ is the in-tertemporal rate of substitution)?
If the intertemporal rate of substitution is high (i.e., 1/θ is high), households will be more responsive in their savings to a difference between the real interest rate and their discount rate. This is because they are more willing to substitute between consumption at different points of time to obtain the same utility. So, if r(t) > ρ, they will save even more today in order to have faster growth of consumption towards the steady state.
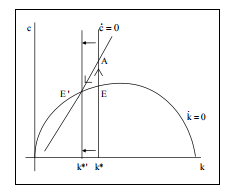
(c) Why does consumption immediately jump up if households suddenly become less pa-tient (i.e., ρ ↑)? Draw the phase diagram and transition path of the economy to the new steady state.
If households become less patient, it will shift the
3. In the Romer model, the first-order conditions for the profit-maximizing firms imply (amongst other things) that
. Also, the equilibrium output (per capita) growth is max
.
(a) In words, provide an economic interpretation for the decision by output good firms about how much labour to employ in producing output (i.e., L(i)).
The first-order condition implies a downward-sloping demand curve for firms in hiring labour to produce output. In particular, it is easy to see that there is an inverse relation-ship between quantity demanded and the price of the input. Firms will hire this particularinput for the right price because all other inputs are imperfect substitutes. The first-order condition ensures firms are minimizing costs and, therefore, maximizing profits.
(b) Given φ determines the substitutability among labour inputs in the Ethier production function, with higher φ corresponding to more substitutability, what is the economic interpretation of the exponent
in the expression
and what does it imply about the price, p(i), an R&D firm can charge for use of its labour services L(i) relative to its marginal costs?
The exponent corresponds to the elasticity of demand for labour services in the input mar-ket. The higher the elasticity of demand, the less pricing power the R&D firm selling labour services has. This corresponds to a higher elasticity of substitution, thus meaning firms can look for other labour input services as near substitutes if the price of a given labour service is too high.
(c) Why is there no endogenous growth if the discount rate
(Hint: What does the discount rate ρ imply about present value discounting?)
If the discount rate is higher, then the real interest rate on the balanced growth path will be higher. This will reduce the present value of future profits and could make it unprofitable for R&D firms to produce new ideas. If this is the case, there will be no endogenous growth.
4. In the RBC model with 100% depreciation and no government, the equilibrium saving rate is
, n < ρ, and labour supply per person is
, where α is the capital share in the Cobb-Douglas production function, y = kα, n is the population growth rate, ρ is the discount rate, and b is the weight on (log) leisure in the instantaneous utility function.
(a) Show that equilibrium labour supply,
, would decrease if the capital share increased (i.e., α ↑). Explain why.
The equilibrium labour supply is equivalent to
. Then, because n < ρ,
< 1 and an increase in α would necessarily cause the term
to increase. This would mechanically cause a reduction in
(b) Describe in words how the equilibrium can be solved for in this case of the RBC model. (Hints: Decentralized equilibrium or social planner? What choice variables do you need to solve for that determine the remaining variables? What equilibrium conditions do you need to solve for these variables? What do you do to the equilibrium conditions and what do you substitute in for when solving? Do you need to posit a solution for any variables in order to solve?)
Equilibrium can be solved for by finding the decentralized equilibrium or solving the social planner’s problem that maximizes household utility. For the decentralized equilibrium, it is necessary to fifirst solve for equilibrium in factor markets that relate the real inter-est rate to intensive capital and the wage to intensive capital and technology. Then,solve for the household’s decisions in terms of consumption/savings and labour/leisure. Household savings must equal investment and household labour supply must equal labour demand in general equilibrium.
Take the Euler equation, take logs, and substitute in for the real interest rate from capital market. Posit a fixed saving rate s and solve for it as given above.
Take the first-order condition for labour l, take logs, and substitute in for the real wage rate from the labour market. This leads to a solution for labour supply that is constant and given above.
2021-04-13