MATH 221 MATLAB Assignment 6
MATH 221 MATLAB Assignment 6
Learning Goals
• Analyze mathematical models of dynamical systems
Instructions
• Login to MATLAB Online (or open MATLAB on your own computer)
• Consult the MATLAB documentation
• Submit your file assignment6.mat to Canvas
Question 1: Insect population models
Consider a simple mathematical model of an insect population consisting of eggs, nymphs and adults. Let  ,
,  and
and  be the number of eggs, nymphs and adults respectively in month n. The whole population structure in month n can be written as a vector

Suppose that each adult produces 800 eggs per month. Of the eggs, 3% survive each month to become nymphs in the next month. Then 5% of the nymphs survive each month to become adults in the next month. Finally, 99% of adults die after producing eggs but 1% survive and remain as egg-producing adults in the next month. Note that all adults in this model produce eggs (see this discussion of shortcomings in population models). Suppose that someone initially releases 10 adult insects into a new habitat. In other words, suppose the initial population vector is

(a) Find the update matrix A such that
. Save the matrix A as Q1Amat.
(b) How many adults will there be after 12 years have passed? Save the value as Q1Bnum.
(c) What is the long-term steady-state of nymphs/adults? Save this fraction as Q1Cnum. It may be helpful to recall the following fact about complex numbers. Any complex number z = a + ib has a magnitude
. The key fact about magnitude that
for any two complex numbers
,
. Therefore, if |z| < 1, then lim

Question 2: Input-output models in economics
Consider an island nation with a closed economy with distinct economic sectors: shrimp fishing, corn farming, construction (of buildings), oil (for energy) and service. Assume that there are no imports or exports from the island and that everything that is produced is consumed. This is called a closed-exchange model. Each sector of the economy uses products of the various sectors as follows:
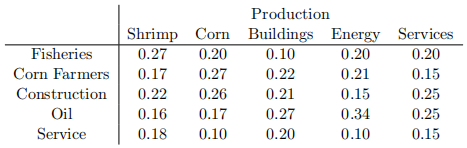
Each row displays the consumption of each sector (each number is a fraction of the total production of that type). For example, the oil sector accounts for 27% of all new build-ings constructed. Notice that each column adds to one meaning that all the production is consumed. Now, let
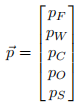
be the prices (in $) of the fisheries, corn farmers, construction, oil and service sectors respec-tively. For example, pF is the total income of the fisheries as well as the cost of all the shrimp. If the fisheries produces $1000 worth of shrimp, then the income of the fisheries will also be $1000 since all of the shrimp are bought and all that income goes to the fishing sector. Since the economy is closed, we must have  where L is the matrix describing the distribution of products (essentially, the table above). The system of equations can be rewritten as
  and solved.
(a) Enter the matrix L (the entries in the table above) and save the matrix as Q2Amat. (Hint: The command sum(L) returns the sums of the columns of the matrix. You can use this to check that you have entered the matrix correctly.)
(b) Assume the total value of all shrimp produced is $1000. Solve
Question 3: Google PageRank algorithm
Let’s see how the original Google search engine algorithm worked. Input some words in the search bar and Google finds all the webpages containing the search words. But then the big challenge is to rank the pages to find the most popular webpages. The idea of the PageRank algorithm is to rank the popularity of a webpage by how other pages link to it. Let’s consider a small set of webpages A, B, C, D and E:
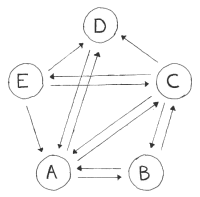
The arrows indicate a link from one webpage to another. We can represent this in a table:
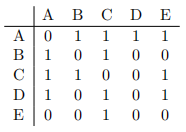
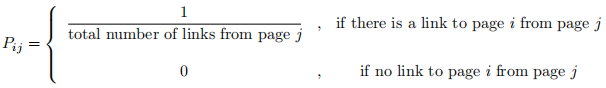
In the table, 1 means that the webpage in the column links to the webpage in the row, and 0 means no link. For example, webpage E links to A but webpage A does not link to E. Now imagine you are randomly surfing the web clicking random links on a page. The probability that you navigate to page i from page j is
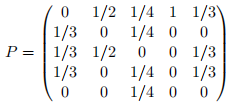
This gives us the transition matrix for the set of webpages A, B, C, D and E above:
Finally, the PageRank vector is the steady state vector  satisfying
  such that all the entries of are greater than or equal to 0 and the entries of add up to 1. In other words, the PageRank vector tells us the probability that you are on page i after a long time clicking random links and therefore we rank the pages by this probability.
(a) Use MATLAB to find the PageRank vector of these pages (in order ABCDE). Save the vector as Q3Avec. (You should find that page A is the most popular and page E is the least popular.)
(b) Suppose you control webpage E and you would like to improve your standing in the ranking by adding or subtracting links from your page. So you try adding a link to page B. Store the new PageRank vector as Q3Bvec. Did this manoeuvre help improve the ranking of your webpage? Enter your observation as 'yes' or 'no' and save the text as Q3Btext.
(c) Finally, you put your page back as it was to start with and call your friend who runs webpage A and ask her to add a link to your page E and she agrees. Find the new PageRank vector and save the result as Q3Cvec. Did that help your ranking? Enter your observation as 'yes' or 'no' and save the text as Q3Ctext.
Submit your assignment
The answer to each question in the assignment is a MATLAB variable. Check the workspace window to verify that you have a value stored for each of the questions: Q1Amat, Q1Bnum, Q1Cnum, Q2Amat, Q2Bvec, Q3Avec, Q3Bvec, Q3Btext, Q3Cvec and Q3Ctext. Save all your variables to a .mat file called assignment6.mat with the command:
>> save('assignment6.mat')
The save command creates a file in your account on MATLAB Online and you should see the file in your current folder window. Select the file and click the Download button from the toolbar. Now upload the .mat file to the assignment page on Canvas. See the YouTube video for a demonstration.
2021-04-12