MATH10282 Introduction to Statistics
MATH10282 Introduction to Statistics
Semester 2, 2020/2021
Coursework assignment using R
The deadline for submitting this coursework is 10:00am on Thursday 13 May 2021. Please submit your work to Blackboard.
This coursework comprises 10% of the overall marks for the module.
Instructions
(a) You can include code and numerical results from R by copying and pasting into your document. Comments and discussion of the results should be added as required. You can save any plots created in R, for example as a PDF, and import these into your final report. If you wish to include handwritten section (e.g. with mathematical notation), you may do so by including a scan or photo of the handwritten part in your report.
Include in your report all R commands used to generate results.
(b) Please include your name and ID in your report. If you have any queries or prob-lems, please contact me as soon as possible.
(c) Your report should not be longer than 5 printed pages. Longer reports will be penalised.
To determine whether glaucoma affects the corneal thickness, measurements were made in 8 people affected by glaucoma in one eye but not in the other. The corneal thicknesses (in microns) were as follows
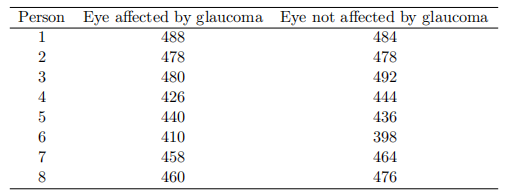
(a) Compute the mean, median, standard deviation, maximum and minimum of the data on eye affected by glaucoma. [1]
(b) Compute the mean, median, standard deviation, maximum and minimum of the data on eye not affected by glaucoma. [1]
(c) Compare the results in parts (a) and (b) and comment. [1]
(d) Draw boxplots of the data on eye affected by glaucoma and the data on eye not affected by glaucoma. Plot them side by side and comment on how they compare. [1]
(e) Fit a normal distribution to the data on eye affected by glaucoma.. Comment on the adequacy of the fit of the normal distribution. You may use the Kolmogorov Smirnov test by using the R command
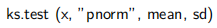
where x contains the data, mean is the sample mean of the data, and sd is the sample standard deviation of the data. If the p-value returned by the command is above 0.05 you may consider the distribution as providing an adequate fit. [1]
(f) Fit a normal distribution to the data on eye not affected by glaucoma and com-ment on the adequacy of its fit. [1]
(g) Construct a 95% confidence interval for the difference between the population mean of the data on eye affected by glaucoma and the population mean of the data on eye not affected by glaucoma. You may assume that the sample stan-dard deviations computed in parts (a) and (b) are the true population standard deviations. Comment on the confidence interval. Does the confidence interval suggest that glaucoma affects the corneal thickness? [2]
(h) Let
= the population mean of the data on eye affected by glaucoma and
= the population mean of the data on eye not affected by glaucoma. Test the hypothesis
versus
at the five percent level of significance. You may assume that the sample standard deviations computed in parts (a) and (b) are the true population standard deviations. Report conclusions of the test. [2]
[Total 10 marks]
2021-04-12